Un'analisi di 8 creatori di grafici e grafici AI per una facile rappresentazione dei dati
Al giorno d’oggi, la capacità di comunicare le informazioni in modo efficace è vitale. Per visualizzare dati complessi, diagrammi e grafici sono stati per molti un metodo di riferimento. Tuttavia, alcuni ritengono che la loro creazione richieda molto tempo, mentre altri lo considerano un processo frustrante. Ma ora ci sono anche Creatori di grafici e grafici basati sull'intelligenza artificiale che possiamo usare. Stai cercando un creatore di grafici a torta o altri strumenti per creare facilmente i grafici e i diagrammi desiderati? Ti abbiamo coperto. Vieni a conoscerli uno ad uno per poter scegliere quello giusto per te.

- Parte 1. Zoho Analytics
- Parte 2. Trama
- Parte 3. Quadro
- Parte 4. GraphMaker
- Parte 5. Chartify
- Parte 6. GraficoGPT
- Parte 7. Highcharts GPT
- Parte 8. GraficoAI
- Parte 9. Bonus: Facile strumento per creare grafici e diagrammi basato sull'intelligenza artificiale
- Parte 10. Domande frequenti su AI Chart Graph Maker

In qualità di scrittore principale del team editoriale di MindOnMap, fornisco sempre informazioni reali e verificate nei miei post. Ecco cosa faccio di solito prima di scrivere:
- Dopo aver selezionato l'argomento sul creatore di grafici AI, faccio sempre molte ricerche su Google e nei forum per elencare i software che interessano di più agli utenti.
- Poi utilizzo tutti i grafici creati dall'intelligenza artificiale menzionati in questo post e trascorro ore o addirittura giorni a testarli uno per uno.
- Considerando le caratteristiche principali e i limiti di questi strumenti di creazione di grafici basati sull'intelligenza artificiale, concludo in quali casi d'uso questi strumenti sono più adatti.
- Inoltre, leggo i commenti degli utenti sul creatore di grafici AI per rendere la mia recensione più obiettiva.
| Programma | Piattaforma supportata | Funzionalità dell'intelligenza artificiale | Caratteristiche principali | Facilità d'uso | Opzioni di esportazione |
| Zoho Analytics | Basato sul Web | Raccomanda i tipi di grafici e identifica tendenze/modelli | Analisi avanzate, reporting completo, dashboard personalizzabili | Moderare | Excel, PDF, HTML, CSV, ecc. |
| Trama | Librerie basate sul Web e Python | Una funzionalità basata sull'intelligenza artificiale per l'analisi dei dati | Tabelle e grafici personalizzabili, visualizzazione dinamica, tracciamento interattivo | Avanzato (codificazione richiesta per il pieno potenziale) | PNG, JPEG, PDF, SVG, HTML, JSON |
| Quadro | Windows, macOS e Web | Analisi basata sull'intelligenza artificiale, motore di raccomandazione | Visualizzazione interattiva, creazione di dashboard, analisi potenti | Moderare | BMP, JPEG, PNG, SVG, PowerPoint, PDF |
| GraphMaker | Basato sul Web | Consiglia i tipi di grafico dopo aver inserito un prompt. | Vengono offerti la creazione semplice di grafici e vari modelli | Moderare | JPG, PNG, SVG e PDF |
| Chartificare | Basato sul Web | Suggerimenti automatici dei grafici dopo il caricamento di un file. | È disponibile l'opzione di trascinamento della selezione per una generazione di grafici più rapida. | Moderare | JPG, PNG |
| GraficoGPT | Basato sul Web e mobile | Utilizza un generatore di intelligenza artificiale per trasformare i suggerimenti in grafici e diagrammi | Creazione di grafici basata sull'intelligenza artificiale, input basato su testo | Facile | PNG |
| Highcharts GPT | Basato sul Web | Genera grafici basati su descrizioni in linguaggio naturale (Beta) | Componenti grafici completi, API flessibile, ampia personalizzazione | Facile | PNG, JPEG, PDF, SVG, CSV, Excel, JSON |
| GraficoAI | Basato sul Web | Crea grafici basati sui dati e sull'input dell'utente | Generazione automatizzata di grafici, connessioni dati, visualizzazione dati, libreria di modelli | Moderare | PNG, JPEG, PDF, SVG, CSV, Excel, Fogli Google, |
Parte 1. Zoho Analytics
Ideale per: Aziende che richiedono reporting completo e soluzioni analitiche.
Zoho Analytics funge da strumento versatile per generare diagrammi e grafici. È particolarmente vantaggioso per le aziende che necessitano di report e analisi dettagliati. A parte questo, per coloro che già utilizzano la propria suite di strumenti. Offre anche dashboard personalizzabili che puoi utilizzare. Ma tieni presente che non crea grafici direttamente da zero utilizzando l'intelligenza artificiale. Tuttavia, può consigliare tipi di grafici in base ai dati. Inoltre, identifica le tendenze per rendere le tue visualizzazioni più approfondite.
Prezzi:
◆ Basic - $24/mese fatturato annualmente; $30/mese fatturato mensilmente
◆ Standard - $48/mese fatturato annualmente; $60/mese fatturato mensilmente
◆ Premium - $115/mese fatturato annualmente; $145/mese fatturato mensilmente
◆ Enterprise - $455/mese fatturato annualmente; $575/mese fatturato mensilmente
Parte 2. Trama
Ideale per: Sviluppatori e data scientist che necessitano di grafici altamente personalizzabili e interattivi.
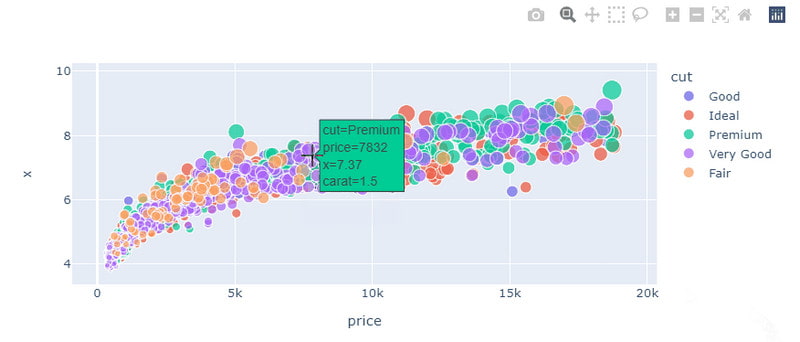
Un altro strumento grafico AI da considerare è il programma Plotly. Si distingue per la sua versatilità nella visualizzazione dei dati. Fornisce inoltre una libreria di diagrammi e grafici che puoi personalizzare come desideri. Detto questo, può anche essere uno dei tuoi siti Web AI con grafici a torta. Con esso puoi creare grafici di base come grafici a linee, grafici a barre, grafici a dispersione e altro ancora. Questo è anche il motivo per cui è una scelta popolare tra i professionisti dei dati, grazie alle funzionalità offerte. Sulla base dell'esperienza pratica, riteniamo che lo strumento sia un po' difficile da utilizzare. Pertanto, alcuni utenti potrebbero trovarlo complesso, soprattutto quelli che hanno meno familiarità con gli ambienti Python o R.
Prezzi:
◆ Compila un modulo per un preventivo personalizzato.
Parte 3. Quadro
Ideale per: Utenti che necessitano di potenti strumenti di narrazione visiva.
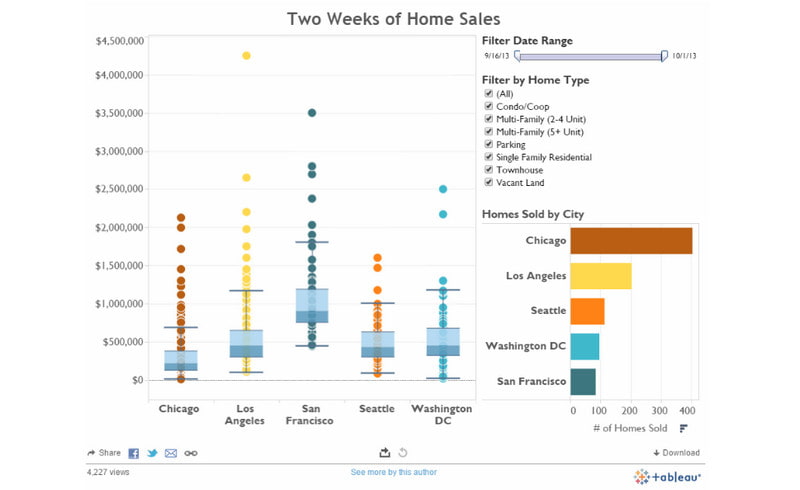
Se lavori su attività complesse di analisi dei dati, puoi anche fare affidamento su Tableau. È un programma che eccelle anche nell'offrire funzionalità basate sull'intelligenza artificiale per la visualizzazione dei dati. Non solo è noto per i suoi dashboard interattivi. Ti aiuterà a esplorare i dati e a trovare gli approfondimenti che puoi. Quindi, si tradurrà in rappresentazioni efficaci. Al momento dell'utilizzo, è necessario completare il modulo e il suo server è occasionalmente lento. Questi sono solo alcuni degli svantaggi dello strumento.
Prezzi:
◆ Visualizzatore: $15/mese per utente
◆ Explorer: $42/mese per utente
◆ Creatore: $75/mese per utente
Parte 4. GraphMaker
Ideale per: Utenti che necessitano di creazione rapida e semplice di diagrammi e grafici per presentazioni e report.
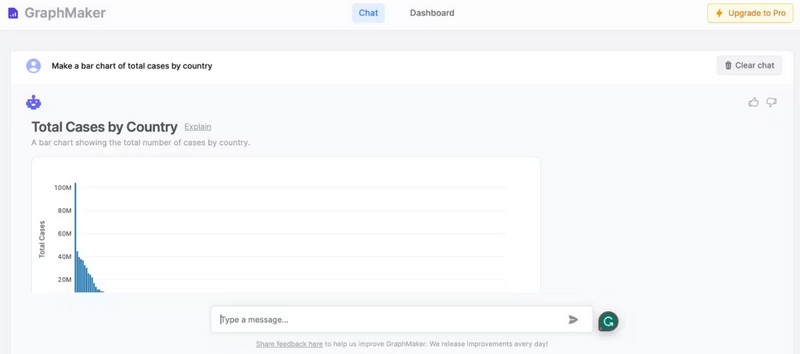
Un altro creatore di grafici AI a cui dovresti dare un'occhiata è GraphMaker. È un programma basato su chatbot in grado di generare diagrammi e grafici in un istante. Lo strumento viene fornito con dati precaricati. Ma la cosa buona è che puoi anche caricare i tuoi file in diversi formati. Successivamente, la sua intelligenza artificiale li analizzerà per te. Mentre il nostro team lo testava, abbiamo scoperto che puoi ottimizzare i tuoi grafici come desideri. Usando la sua interfaccia chatbot, potresti avere una conversazione con l'intelligenza artificiale discutendo del grafico che desideri. Ma tieni presente che non è così avanzato come le piattaforme BI.
Prezzi:
◆ Gratuito
◆ Pro - $15/mese
Parte 5. Chartify
Ideale per: Coloro che desiderano creare diagrammi e grafici interattivi da varie origini dati.
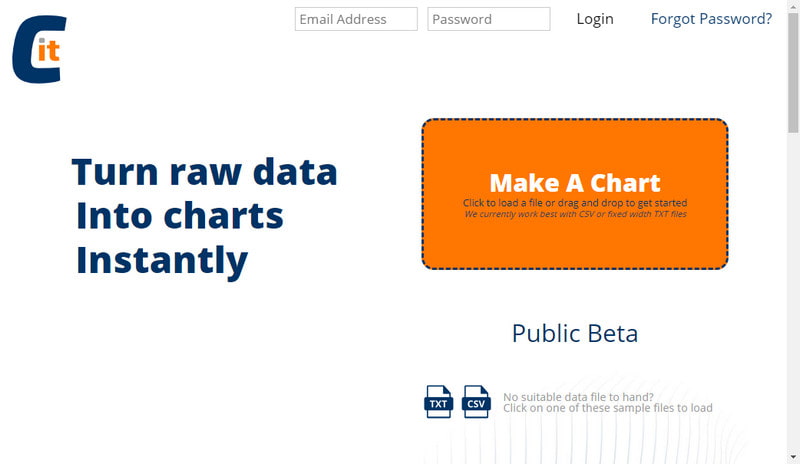
Ora, Chartify offre un nuovo approccio come strumento di intelligenza artificiale per mostrare i tuoi dati. È uno strumento di creazione di grafici automatico che crea bellissimi grafici dai tuoi file di dati. Significa che puoi caricare o connettere i tuoi file dall'archivio online. Successivamente, Chartify fa il resto. Lo scopo principale di questo strumento è consentirti di concentrarti sulle informazioni rivelate dai grafici. Lo troviamo anche comodo in quanto non richiede l'inserimento manuale dei dati. L'unico inconveniente è che non hai la possibilità di perfezionare il grafico e i suoi dati.
Prezzi:
◆ Gratuito
Parte 6. GraficoGPT
Ideale per: Utenti che desiderano sperimentare la generazione di grafici basata sull'intelligenza artificiale in base a descrizioni di testo.
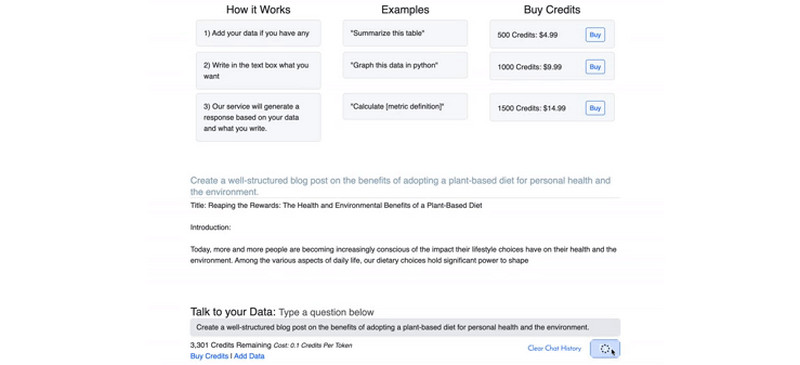
ChartGPT utilizza l'intelligenza artificiale per generare grafici basati sulle descrizioni testuali dei dati. È un open source creatore di torte e grafici che trasforma il testo in grafici accattivanti. Puoi semplicemente dire a ChartGPT di cosa hai bisogno. Quindi, farà il suo lavoro cercando dati rilevanti da includere nei tuoi grafici. Al momento dell'utilizzo, offre un metodo semplice e veloce per visualizzare i dati vitali. In questo modo, non è necessario cercarli manualmente. Eppure ecco un problema, ha crediti AI limitati solo se lo usi per la prima volta. Inoltre, non ha alcuna opzione per il caricamento di file di dati. Tuttavia, è ancora un buon strumento AI da testo a grafico.
Prezzi:
◆ Gratuito
◆ Crediti consumabili: inizia da $5 per 20 crediti
Parte 7. Highcharts GPT
Ideale per: Creazione di grafici in base alla semplice descrizione o istruzione dell'utente.
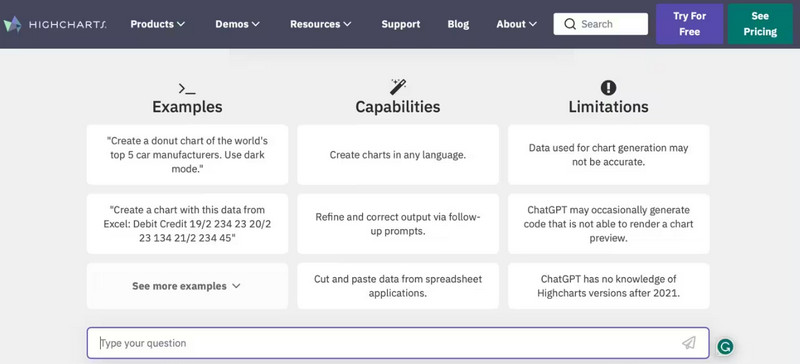
Come suggerisce il nome, è un programma di grafici basato su GPT. Significa che Highcharts GPT genera grafici in base al tuo input. Inoltre, è una delle principali librerie di grafici che garantisce risultati dall'aspetto professionale. Anche se sei un principiante, puoi generare grafici impressionanti con esso. Il fattore più importante che abbiamo notato è dovuto alla sua interfaccia intuitiva. Inoltre, ti consente di utilizzarlo su varie piattaforme. In questa nota, puoi adattarlo perfettamente al tuo flusso di lavoro. Ma sfortunatamente, Highcharts GPT ha una conoscenza limitata, valida solo fino al 2021. Inoltre, la stessa cosa con ChartGPT, non puoi caricare alcun file su di esso. Tuttavia, vale comunque la pena provare questo generatore di grafici AI gratuito.
Prezzi:
◆ Gratuito
Parte 8. GraficoAI
Ideale per: Utenti che desiderano una creazione di grafici rapida e semplice con l'assistenza dell'intelligenza artificiale.
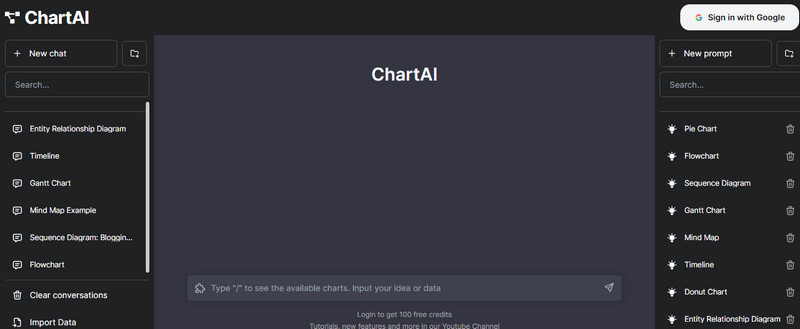
Un'altra piattaforma AI che ti aiuterà grafici e grafici artigianali è ChartAI. È un sito Web popolare che ti consente di trasformare i tuoi dati in visualizzazioni straordinarie. Indipendentemente dal tuo livello di esperienza, puoi usarlo. La sua interfaccia intuitiva ti guiderà attraverso il processo, così come ha guidato il nostro team nella creazione dei grafici. Dato che l’abbiamo testata, la piattaforma utilizza anche un chatbot, quindi descrivere ciò di cui hai bisogno è più semplice. Inoltre, supporta il caricamento di file di dati CSV. Ma ha anche alcune limitazioni. Questi includono tipi di grafici limitati e crediti AI per la versione gratuita. Nonostante ciò, è una buona intelligenza artificiale per disegnare grafici.
Prezzi:
◆ Gratuito
◆ 20 crediti - $5
◆ 100 crediti - $19
◆ 250 crediti - $35
◆ 750 crediti - $79
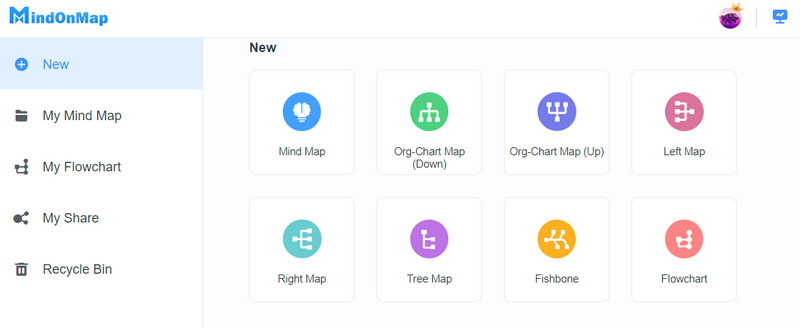
Parte 9. Bonus: Facile strumento per creare grafici e diagrammi basato sull'intelligenza artificiale
Vuoi uno strumento che combini perfettamente i generatori di intelligenza artificiale con il funzionamento manuale? MindOnMap è qui per aiutarti. È una piattaforma online che ti permette di disegnare le tue idee e trasformarle nella rappresentazione visiva desiderata. Puoi usare l'intelligenza artificiale per elaborarle rapidamente. Puoi anche creare autonomamente vari diagrammi e grafici. Diagrammi di flusso, organigrammi, mappe ad albero e altre mappe mentali sono tutti possibili. Offre anche numerose forme e icone che puoi utilizzare nelle tue visualizzazioni. È anche possibile scegliere un tema e uno stile per i tuoi diagrammi e grafici. La parte più interessante è che puoi anche inserire immagini e link senza problemi. Anche per questo motivo lo consideriamo una delle migliori opzioni possibili per la creazione di diagrammi e grafici.
Download sicuro
Download sicuro
Parte 10. Domande frequenti su AI Chart Graph Maker
Esiste un'intelligenza artificiale in grado di creare grafici?
Decisamente sì! Sono disponibili molti strumenti basati sull'intelligenza artificiale che possono aiutarti a creare grafici. Alcuni di essi sono menzionati sopra, controllali uno per uno per vedere quello più adatto a te.
ChatGPT 4 può generare grafici?
Fortunatamente sì. Il suo ChatGPT Plus utilizza GPT-4 dove puoi importare tabelle di dati in diversi formati di file. Quindi creerà istogrammi, grafici a barre, grafici a torta, grafici a dispersione e così via. Tieni presente, tuttavia, che le funzionalità di ChatGPT 4 per la generazione di grafici sono attualmente limitate.
Come faccio a creare un grafico utilizzando ChatGPT?
Innanzitutto devi capire che la versione gratuita di ChatGPT può creare solo tabelle. Ma con ChatGPT Plus, puoi creare il grafico desiderato accedendo al modello GPT-4. Scegli l'opzione Plugin e vai allo store dei plugin. Installa i plugin desiderati come Show Me Diagrams e un altro plugin scelto. Infine, chiedi a ChatGPT di utilizzare questi plugin e visualizzare i tuoi dati.
Conclusione
Alla fine, questo è tutto ciò che devi sapere Generatori di diagrammi e grafici AI. Come mostrato sopra, ce ne sono tonnellate. Quindi, assicurati di scegliere quello di cui hai bisogno. Tuttavia, se hai bisogno di un metodo più rapido che ti permetta di personalizzare ancora di più i tuoi grafici e diagrammi, provalo MindOnMap. La sua interfaccia semplice non ti deluderà nella creazione dei grafici tanto necessari.