RACI Chart Definition [How it Works and When to Use]
What is a RACI chart? It is a project management tool created and designed to define roles and responsibilities across tasks. Its main objective is to ensure accountability and smooth collaboration within the team. By mapping roles, the team can reduce confusion and avoid tasks from slipping through the cracks. Are you interested in learning more about the matrix? Then read on for all the details you need to know. You will also learn how to create the best RACVI chart with the help of an excellent mapping tool. Please read this post to learn more about the discussion.

- Part 1. An Introduction to the RACI Chart
- Part 2. How to Create a RACI Chart
- Part 3. FAQs about RACI Chart
Part 1. An Introduction to the RACI Chart
A Responsibility Assignment Matrix/Chart, also known as RACI chart, is an easy-to-view yet effective project management and visual representation tool that guides teams in determining roles and responsibilities. It removes ambiguity, ensures accountability, and facilitates communication across projects by organizing work into four essential categories: Responsible, Accountable, Consulted, and Informed. Plus, this strategy improves productivity and collaboration by making it easier to determine who is working, who makes decisions, who contributes, and who requires updates.
In addition, the RACI model's ability to offer structure and transparency to complex projects has led to its widespread adoption across industries. The visual representation provides a common vocabulary for defining roles, avoiding overlap, and ensuring no task is overlooked, regardless of team size. Because of its adaptability, it is a useful tool for stakeholders, team leaders, and project managers who wish to maintain project momentum and align expectations.
What Does RACI Stand for?
The RACI stands for Responsible, Accountable, Consulted, and Informed. The term 'Responsible' refers to the individual or team that completes the assignment, whereas 'Accountable' denotes the person ultimately responsible for its completion. Those whose opinions must be heard before choices are taken are considered 'Consulted,' while those who need to be informed of developments or results are considered 'Informed.' These categories work together to provide a precise structure for assigning jobs in every project.
How does the RACI Chart Work?
A RACI chart assigns each role type to the right person, with project tasks on one axis and team members or stakeholders on the other. It is simple to identify and determine who is accountable, who is responsible for implementation, and who requires updates or consultation using this matrix style. Teams can swiftly spot workflow gaps, overlaps, or bottlenecks by displaying responsibilities. The chart ensures clarity throughout the project lifespan by acting as a planning and communication tool.
When to Use a RACI Chart?
You can use the RACI chart in various ways. You can rely on this chart if your projects involve complex tasks, stakeholders, and cross-functional collaboration. Additionally, the chart or matrix is effective for large initiatives, where unclear responsibilities can lead to delays or miscommunication. Moreover, some teams use the RACI chart to clarify roles, plan projects, or enhance processes. With this chart, you can get various advantages. Organizations can improve accountability, reduce confusion, and enhance the overall project efficiency.
Part 2. How to Create a RACI Chart
As we have discussed, the RACI chart plays an important role in project management. If you are looking for an excellent tool to create the best RACI chart, we recommend MindOnMap. With this mapping tool, there is no doubt that you can make the best chart. You can even access all the features you need. You can attach various shapes, colors, text, font styles, arrows, lines, and more. The best part here is that the main interface is straightforward, so that you can use all the functions without any trouble.
In addition, MidnOnMap offers an auto-saving feature. This feature is ideal for preventing losing your map when you accidentally close the tool. You can also rely on its AI to create the best map with high accuracy. We like that there are also ready-made templates you can open to create your visual representation instantly. Lastly, you can export your final RACI chart in various formats, such as PDF, PNG, JPG, DOCX, SVG, and more. Thus, if you need an exceptional chart maker, look no further than MindOnMap.
More Features
- • The tool can help you create a map, manage schedules, craft plans, and more.
- • It can offer a simple-to-operate user interface.
- • The easy sharing feature is available.
- • The tool’s collaboration feature is accessible.
- • The tool is available on desktop, in browsers, and on Android and iOS.
If you want to start creating the best RACI chart using MindOnMap, you can follow the instructions below.
For the first step, click the Free Download button to download MindOnMap to your desktop. After that, you can create your account or connect your Gmail.
Secure Download
Secure Download
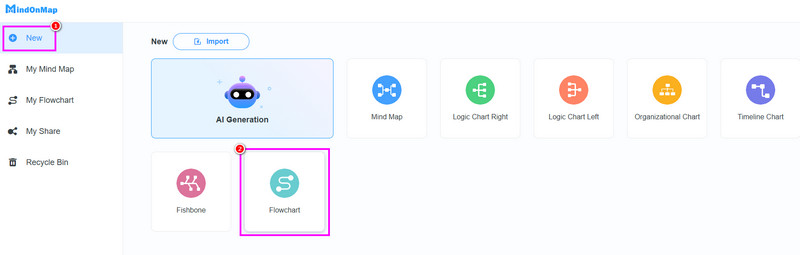
Then, go to the left interface and tap the New section. After that, you can proceed to the Flowchart feature to launch the main user interface.
Once the main layout appears, begin creating the RACI chart. You can proceed to the General section and use all the shapes you want. Double-tap the shape to insert the text inside.
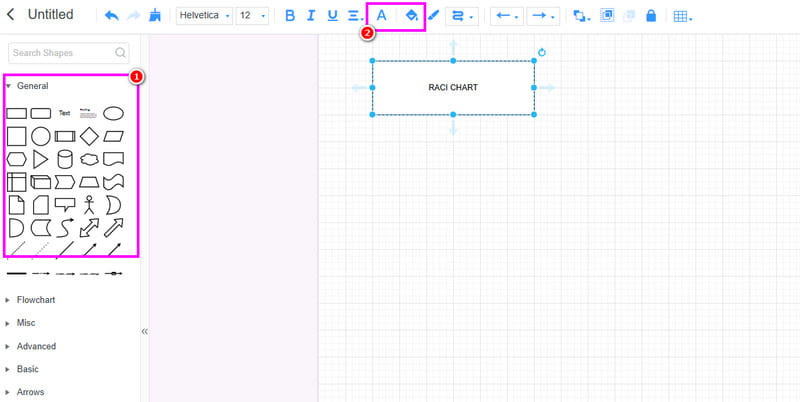
To change the color of the shapes and text, you can access the Font and Fill Color function above.
Once you have finished making the tACI chart, you can begin saving. Tick the Save button above to save the chart on your MindOnMap account.
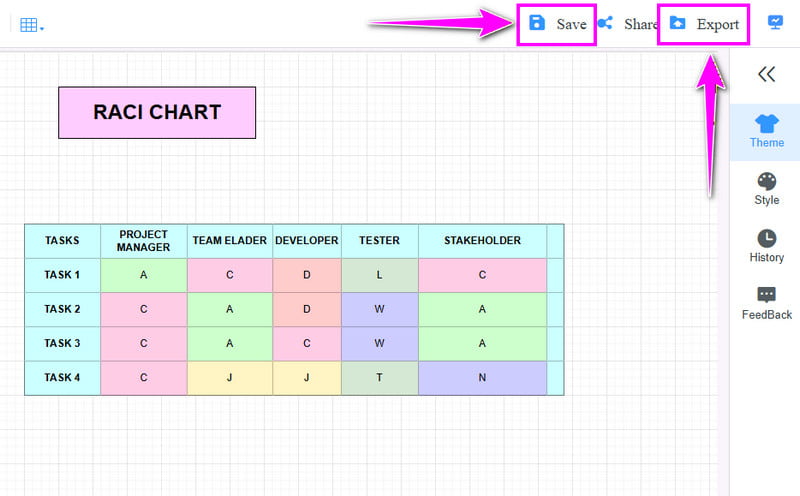
To save the chart to your device, use the Export feature and select a format (JPG, PNG, PDF, or another format) you prefer.
Click here to see the complete RACI chart designed by MindOnMap.
Thanks to this method, you can easily craft an ideal RACI chart for project management. You can access all features smoothly thanks to its simplicity. The tool can help you create additional charts, including sunburst, family tree, and multiflow maps. With that, if you want to build an excellent visual representation, always rely on MindOnMap.
Part 3. FAQs about RACI Chart
What are the benefits of a RACI chart?
The main benefits include enhanced accountability, clearer communication, reduced confusion, and better alignment among team members. Plus, it helps prevent delays by ensuring smooth decision-making and updates.
Is it simple to create a RACI chart?
Creating a RACI chart is simple with the right tool, such as MindOnMap. Since this tool has all the features you need, there is no doubt that creating an excellent chart is possible.
Can I edit my RACI chart?
Definitely, yes. Almost all RACI chart makers can offer an editing feature that lets you edit and update all the details from your chart. This way, you don't have to create a chart from scratch.
Conclusion
Now you have an idea of what a RACI chart is. You also learned how it works and when to use it. Plus, if you want to create your RACI chart, you can access MindOnMap. This chart maker offers all the features you need, ensuring you get the best visual representation after the chart is made.