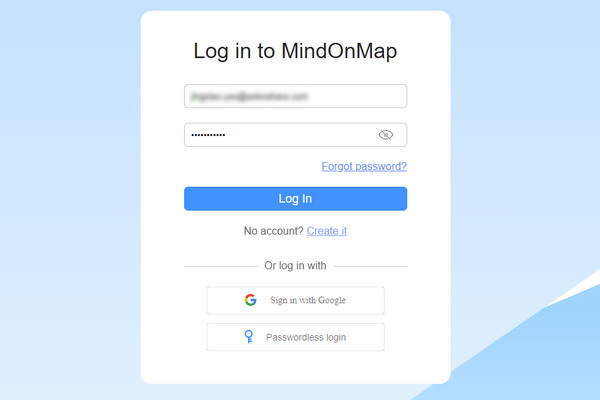
Step 1. Sign in MindOnMap
To enter the Gantt chart-making page and start making, please click the Make Gantt Chart button to sign in with your email.
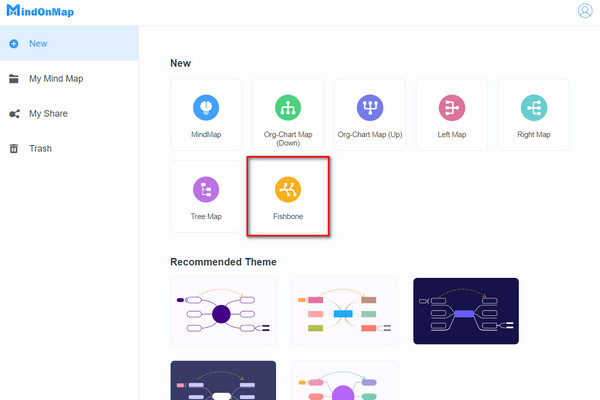
Step 2. Select the Flowchart Button
After that, please switch to the My Flowchart and Start Creating.
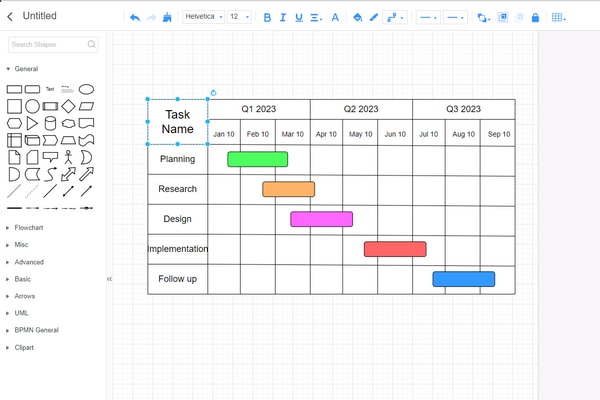
Step 3. Design Gantt Charts
On this page, you can click the Rectangle shape to add it to the canvas and change its size based on your needs. Then, you can build the basic Gantt chart by dragging more shapes and splitting shapes with lines. Later, you can input task names, dates, etc., into these shapes directly. To place colorized bars on the Gantt chart to show the duration of each task, you can click the Rounded Rectangle, change its size by dragging, colorize it by clicking Style > Fill and selecting the color and clicking Apply.
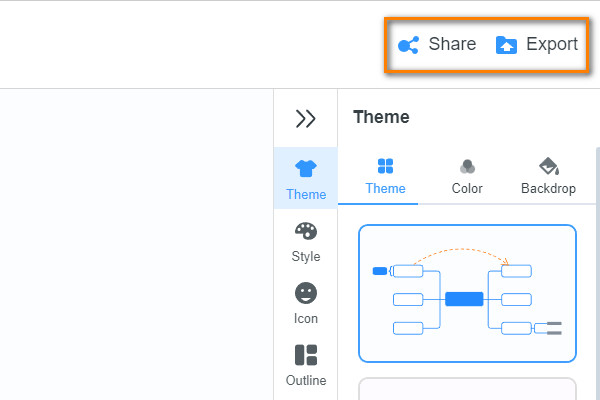
Step 4. Save and Share
MindOnMap can save your Gantt charts automatically, and you can click the Save button. You can click the Share button if you want others to check your Gantt charts.


 My Mind Map
 My Flowchart
 My Profile
 Logout
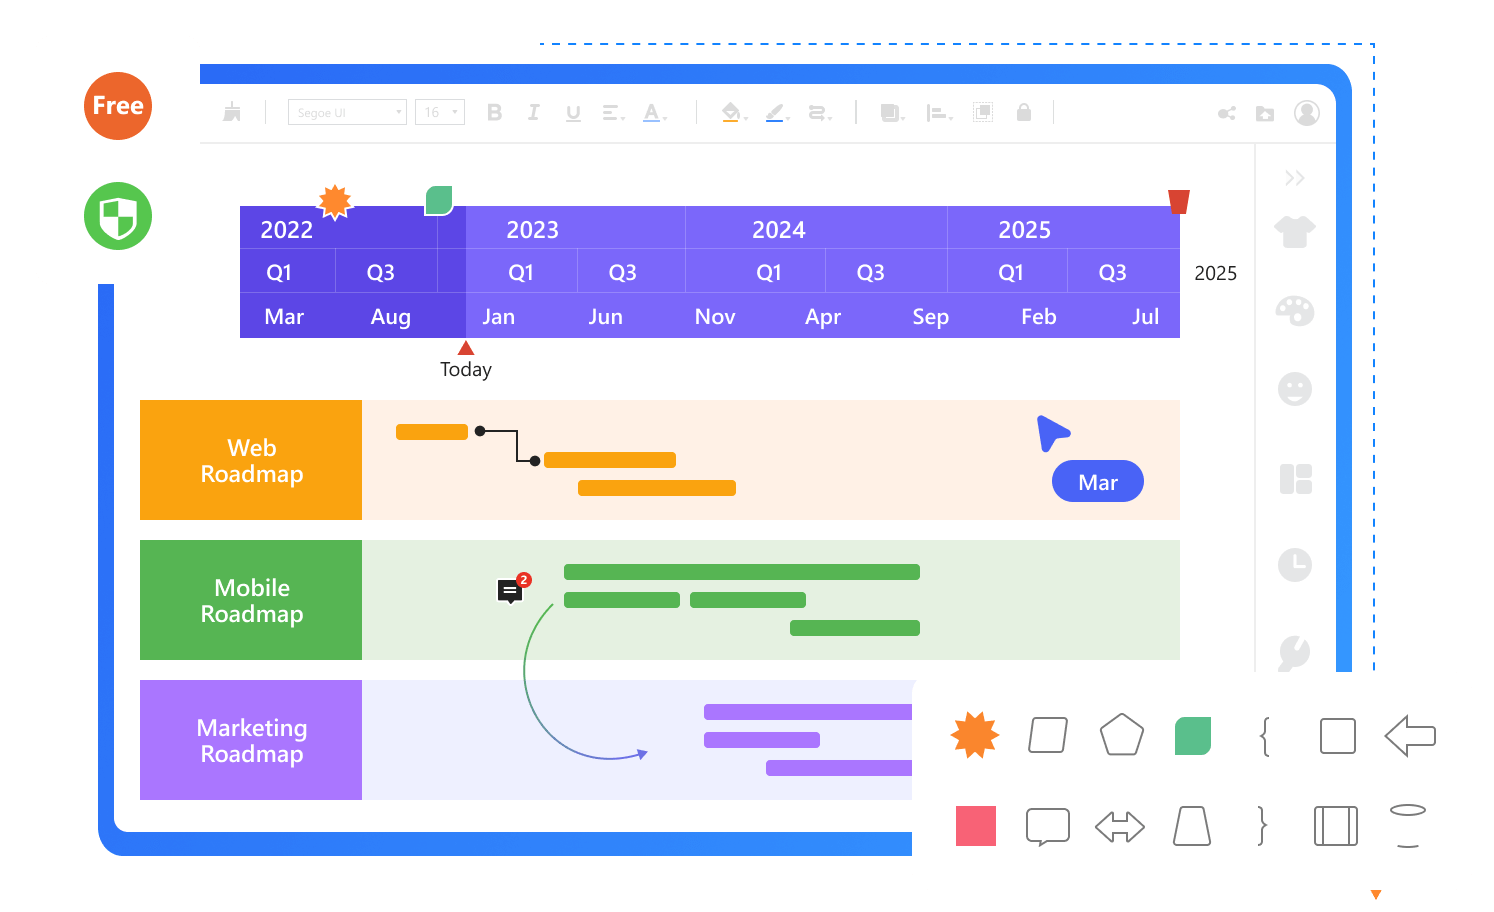


 ORM Diagram
 Tree Diagram
 Mind Map
 ORG Chart
 Flowchart
 Timeline
 Genogram
 PERT Chart
 ER Diagram
 Concept Map
 UML Diagram
 Fishboned Diagram