How to Make a Gantt Chart in Google Docs [Simple Methods]
Gantt Charts are the most used tool for creating project management plans. If you want to set time for your task and prioritize the activities you need to do, Gantt Chart is the best tool to help you. In addition, every time you need a track or need to discuss the process of your projects, you can create a Gantt Chart and share it with your team. But if you do not know how to create a Gantt Chart or what application you will use to create one, then we have the answer you are looking for. In this guidepost, we will show you the most straightforward steps on how to make a Gantt Chart in Google Docs.

- Part 1. Bonus: Free Online Gantt Chart Maker
- Part 2. How to Create a Gantt Chart Using Google Docs
- Part 3. Pros and Cons of Using Google Docs to Make a Gantt Chart
- Part 4. FAQs about How to Make a Gantt Chart in Google Docs
Part 1. Bonus: Free Online Gantt Chart Maker
If you do not have an idea about creating a Gantt Chart, then there is an alternative way to organize your projects and keep track of the dates you need them to be accomplished. Below, we will discuss how to make a gantt chart online. And if you are looking for an alternative to how to do a Gantt Chart in Google Docs, this is the solution for you.
MindOnMap is the best online chart maker you can access on every browser, like Google, Firefox, and Safari. This online application allows you to create charts using this app's shapes and other features. Using the Flowchart option, you can create a chart for project management. Moreover, there are ready-made templates that you can use for creating charts. You can also modify your chart by adding icons, images, stickers, and shapes.
Furthermore, you can export your project in different formats, such as PNG, JPG, JPEG, SVG, and PDF files. MindOnMap is a beginner-friendly application because it has an easy-to-use interface. And if you want to share your project with your team or members, you can share the link and immediately share it with them. What’s even excellent about this application is that it is free and safe to use.
Secure Download
Secure Download
How to make charts using MindOnMap
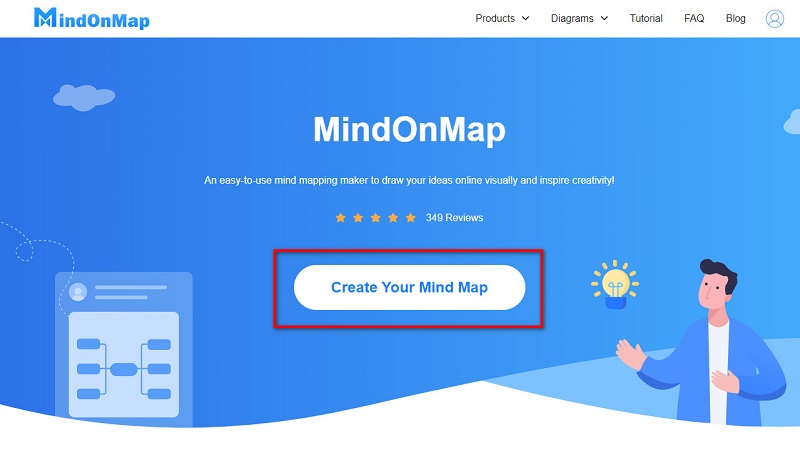
On your browser, access MindOnMap by searching it in your search box. You can also click the link to go directly to the main website. And then, sign in or log in for your account.
Sign in or log in for your account, then click the Create Your Mind Map button to start creating your chart.
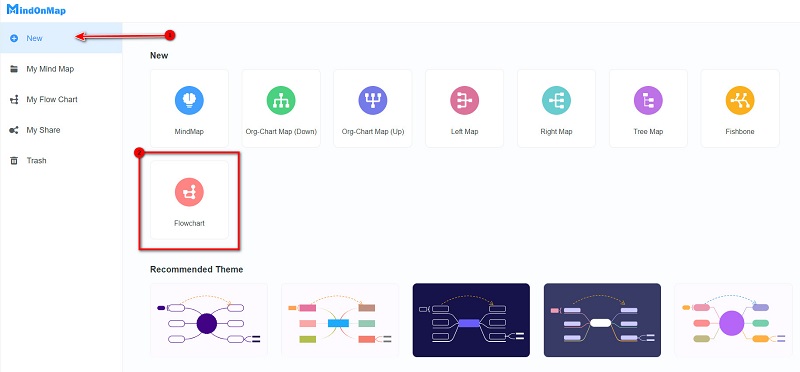
Next, click the New button. You will see the list of charts that you can make using MindOnMap. Select the Flowchart option to create a chart.
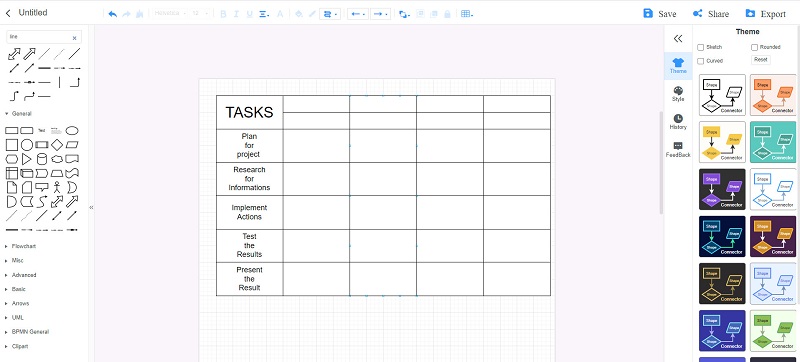
And then, on the shapes, select the rectangle shape and draw a chart on the blank page. Also, you can put lines that will serve as dividers on the rectangles you added. Put text on the squares or rectangles that you created.
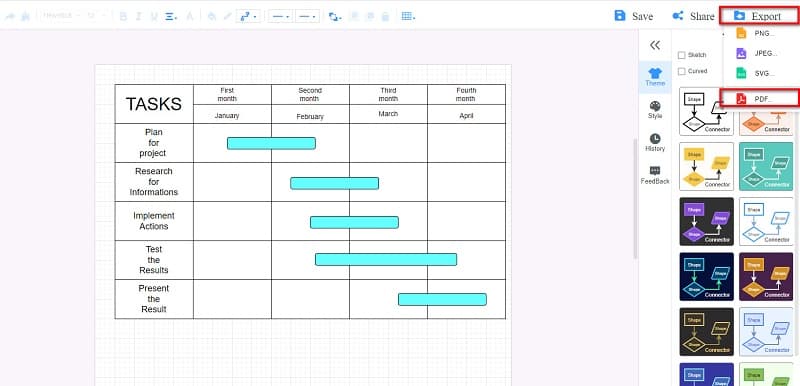
After, add milestones to your chart to identify the date or time you need to do your task. To create a milestone, use the rounded rectangle shape. You can change the color of your milestone as well.
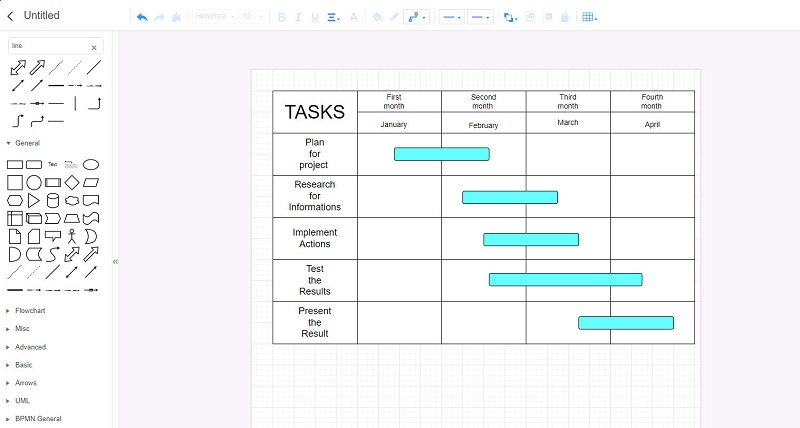
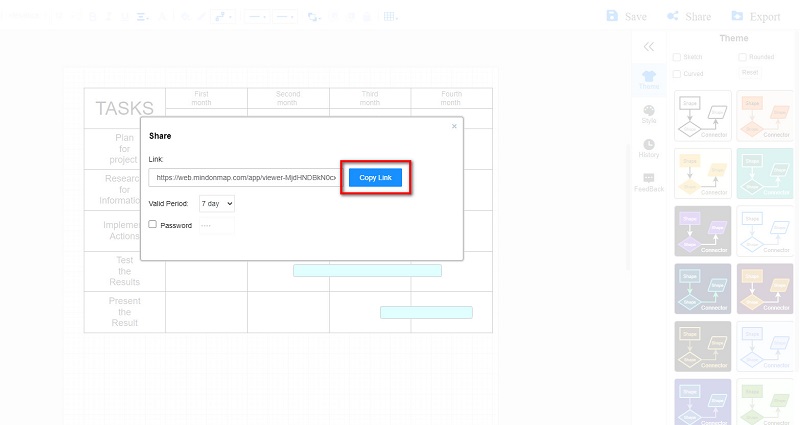
And as you can see, it almost looks like a Gantt Chart. You can share the link with others by clicking the Share icon and copying the link.
Click Export, and select the format you prefer to save your Chart on your device. And that’s it! You have now created a chart for your tasks.
Part 2. How to Create a Gantt Chart Using Google Docs
Google Docs is a tool for creating and editing text documents in your browser. What’s even better is that numerous people can work on a single document. Google Docs is a browser-based application that you can access on all leading browsers, such as Google and Safari. But did you know Google Docs allows you to make Gantt Charts easily? Here are the most straightforward steps to create a Gantt Chart in Google Docs.
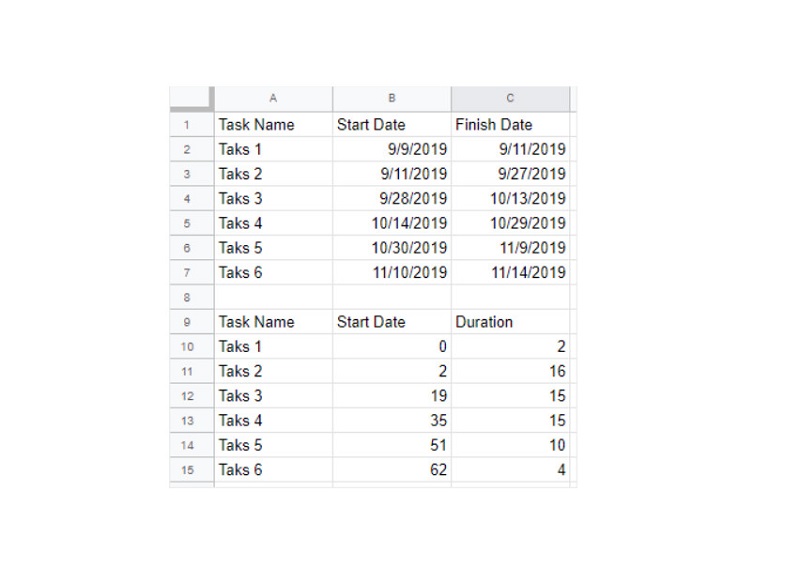
Before you create a Gantt Chart in Google Docs, you must prepare your project data using Microsoft Excel. Save your data on your Google Spreadsheet.
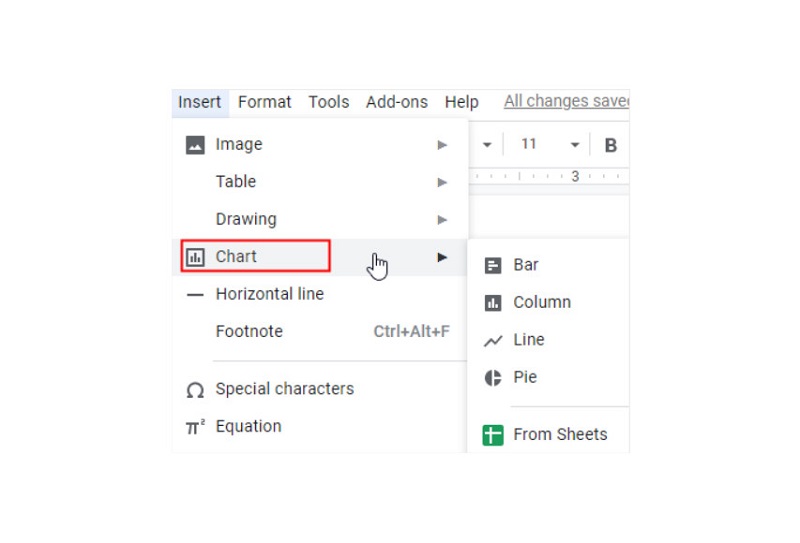
In the browser you use, search Google Docs in the search box. And then, insert a Bar Graph by opening a blank document, going to File, then clicking Chart on the drop-down menu and choosing the Bar option.
And then, a bar graph will be inserted on the page, and click the Open Source button to open an untitled spreadsheet. Paste the data into the table and click the Stacked bar chart on the resulting drop-down menu. The stacked bar chart will appear with the start date and the duration.
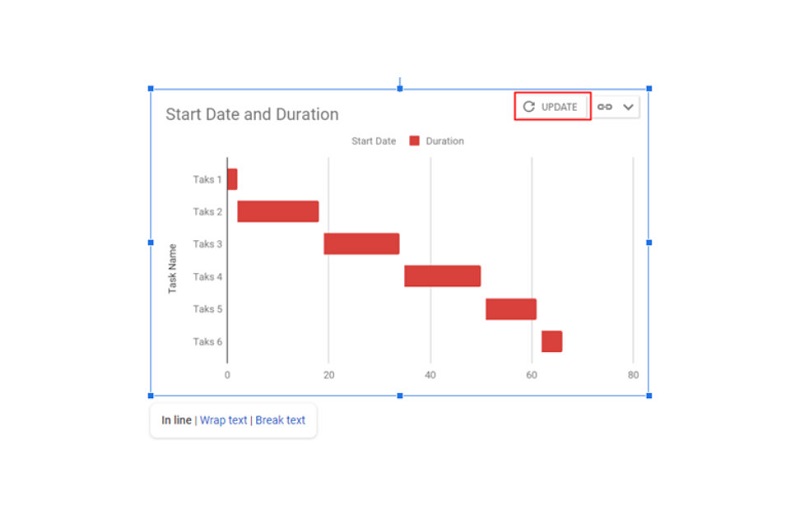
Turn your bar graph into a Gantt Chart by selecting all the blue bars (Start Date). And then, go to the Customize tab, then select None on the Color option. Click the Update button so that the original chart will turn into the Gantt Chart you created.
Aside from inserting a bar chart on Google Docs, you can also insert a Gantt Chart from Google Sheets directly from the page. Go to the File panel, and click the Chart > From Sheets. And then, select the right spreadsheet, then the Gantt Chart will be imported to the page.
And that is how to use Google Docs to make a Gantt Charts tutorial. Follow these simple steps to use the Gantt chart maker.
Part 3. Pros and Cons of Using Google Docs to Make a Gantt Chart
Although Google Docs allows you to make a Gantt Chart, it also has a list of setbacks that you need to consider. Here are the strengths and weaknesses of using Google Docs to make a Gantt Chart.
PROS
- Google Docs is easy-to-use for creating Gantt Charts.
- You can access it on all browsers.
- You can work on your Gantt Chart with your team.
- There is a ready-made chart maker for Google Docs.
CONS
- You must create data using Excel before creating Gantt Charts in Google Docs.
- You cannot make your Gantt Charts look professionally made.
Part 4. FAQs about How to Make a Gantt Chart in Google Docs
Does Google have a Gantt Chart app?
Yes, there is. Gantter is among the most amazing Gantt Chart maker applications for Google. It is a project management software that enables you and your team to create project plans.
Does Google Workspace contain a project management tool?
Google provides project management and works management software to anyone with a Google or Gmail account.
Does Google Docs have a Gantt Chart?
As we mentioned above, you can make Gantt Charts using Google Docs. However, you cannot find a Gantt Chart template on Google Docs.
Conclusion
Now that you are done reading this guidepost, you can now create your Gantt Chart using Google Docs. But if creating a Gantt Chart is a bit challenging, you can create easy-to-make charts using MindOnMap.