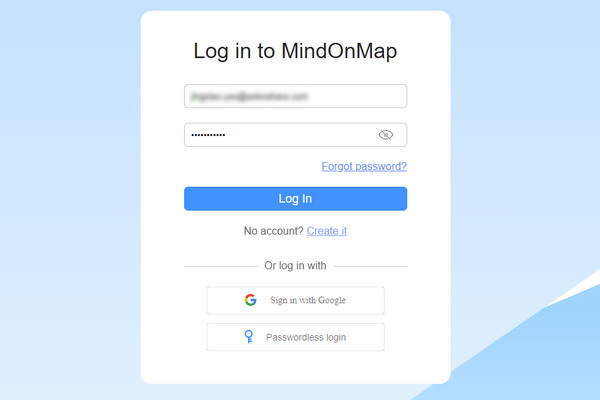
Log in 

-
-
VIP Plan
Credit:0Credits are only available with an active subscription. Please order a subscription.
Upsacle Image(s): 0
Add Credits  My Mind Map
 My Flowchart
 My Profile
 Logout


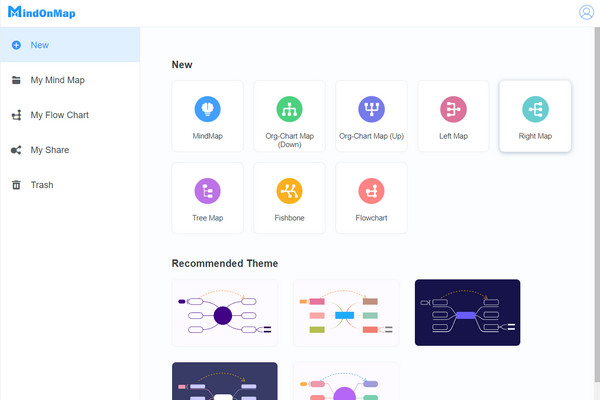
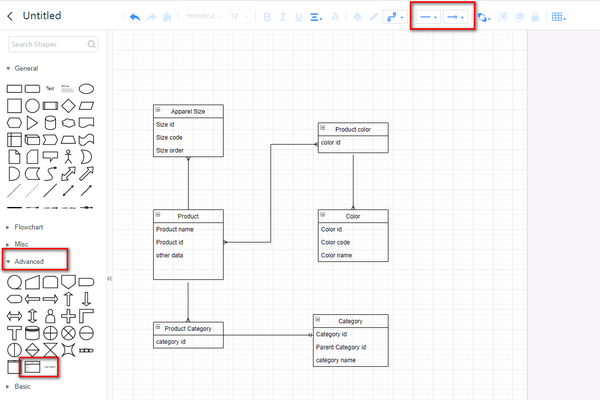


 ORM Diagram
 Concept Map
 Mind Map
 ORG Chart
 Flowchart
 Timeline
 Genogram
 PERT Chart
 Gantt Chart
 Fishbone Diagram
 UML Diagram
 Tree Diagram