Learn the Steps on How to Make a Gantt Chart in PowerPoint Easily
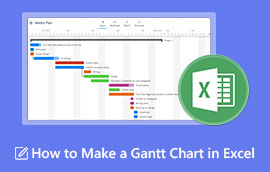
Gantt Chart is a tool that is usually used for project management. It is one of the most standard ways to display activities or tasks within the time you want them to accomplish. You will see this on the left part of your Gantt Chart activities. And on the top of the Gantt Chart is the time scale. Moreover, Gantt Charts show you the activities or projects that must be done first. Gantt Charts are very effective for planning scheduled projects, but we will teach you below if you do not know the steps to create one. Read this guidepost completely to know the easy steps to create a Gantt Chart on PowerPoint.

- Part 1. Bonus: Free Online Chart Maker
- Part 2. How to Create Gantt Chart in PowerPoint
- Part 3. Pros and Cons of Using PowerPoint to Make a Gantt Chart
- Part 4. FAQs about How to Create Gantt Chart in PowerPoint
Part 1. Bonus: Free Online Chart Maker
It is more convenient to use an online tool to create Gantt Charts. Online tools are accessible on your browser, which allows you to save storage space for your device. But if you are looking for an application that allows you to make different kinds of charts, then you better continue to read this part.
Secure Download
Secure Download
How to use MindOnMap
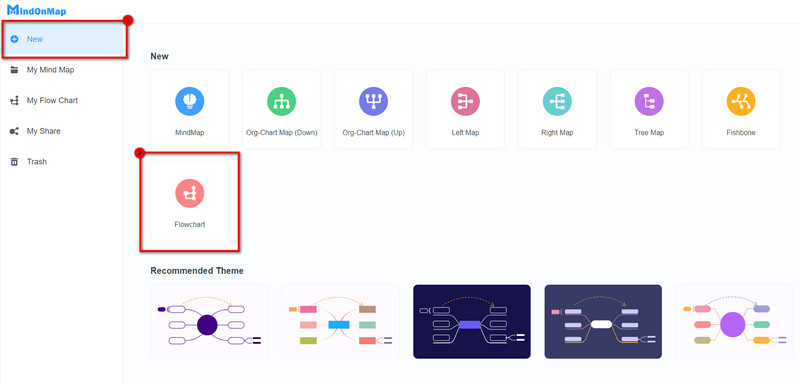
On your browser, search for MindOnMap in the search box. You can click this link to be directed to the main page. Then, on the first interface, log in or sign up for your account, then click the Create Your Mind Map button.

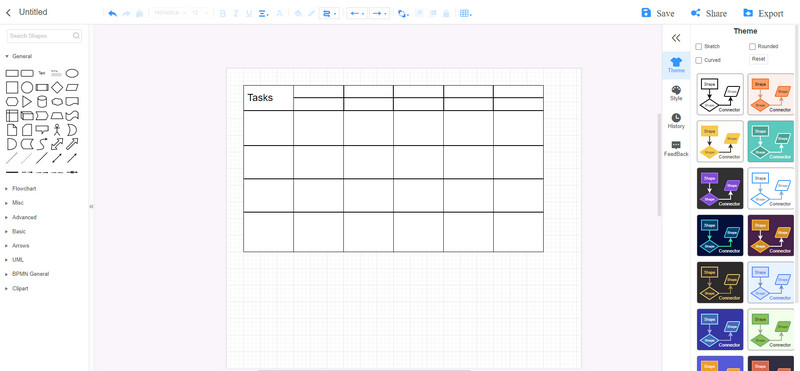
And then click the New button and select the Flowchart option to create your project management plan.
Using the rectangle shape, create a chart similar to the Gantt Chart. You can also create divisions from the rectangles using the lines. You can utilize the shapes that MindOnMap provides to create your project management plan.
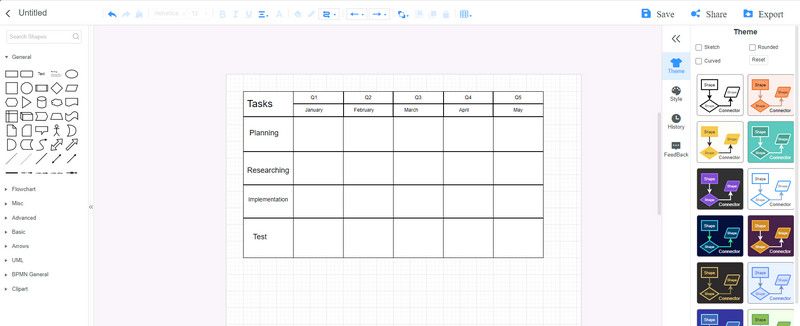
After, click the Text option from the General panel to input the contents of your project management plan.
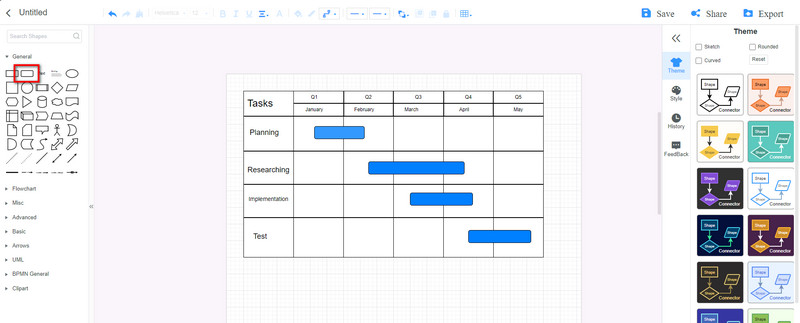
Now, we will add the milestones to the project management plan. Use the rounded rectangle and change the fill color of it.
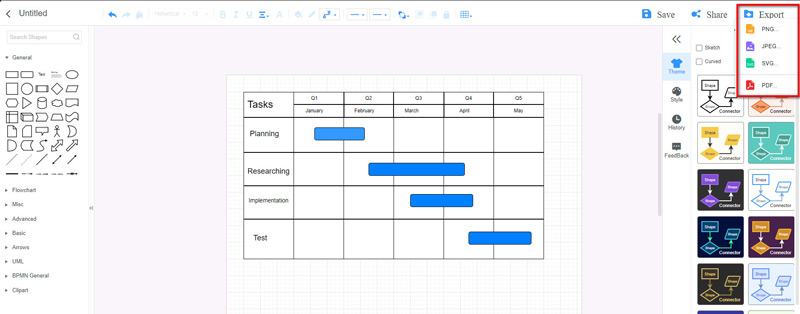
And lastly, click the button to save your output and export it to different platforms. You can select the output format that you like for your project.
Part 2. How to Create Gantt Chart in PowerPoint
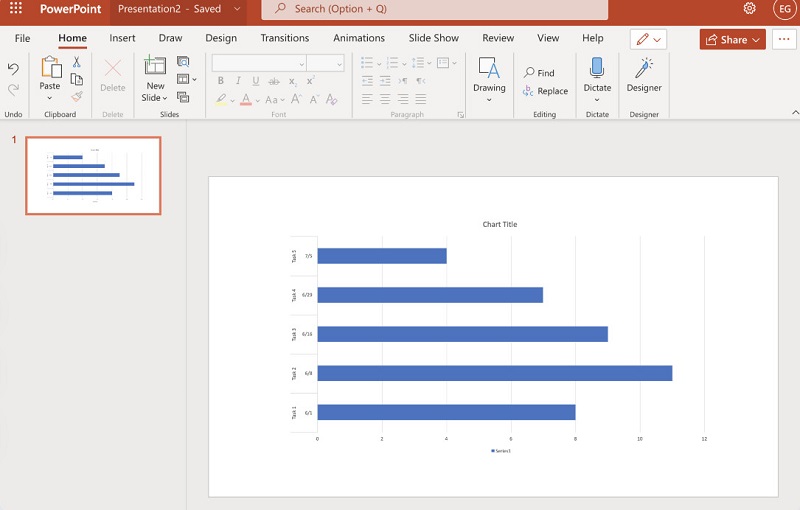
Before using PowerPoint to create a Gantt Chart, you must first fill in your data using Microsoft Excel. Once you complete the data in Excel, you can save it and import it to Microsoft PowerPoint. Select the Insert tab, and click the Charts from the resulting drop-down menu. Then, you will see the chart options you can use for your data.
And then, click the Border Color at the bottom left corner of your screen to change the colors of your borders. It will turn blue once you highlight them. After, you can also put border lines or dots on your data. Click the More Options beside the Border Style, where it contains the following: Dashed Line (default), Dotted Line (default), Double Border (no effect), and None (no border).
Import the data chart that you created using Microsoft Excel. And now, we will create a Gantt Chart in PowerPoint.
Steps how to create a Gantt Chart using Microsoft PowerPoint
If Microsoft PowerPoint isn’t downloaded on your desktop, download and install this Gantt chart creator on your computer. Launch the app once it is installed.
And then, you must choose the Gantt Chart template you want to use. There are many Gantt Chart templates that you can find for project management. You can also create one from scratch. Whatever template you use must have the right detail and information on each bar.
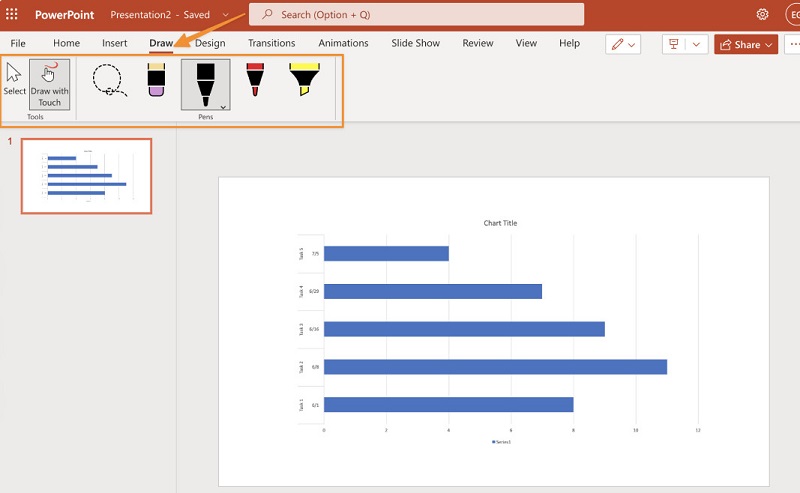
Use the Smart Guide feature to align the items on your Gantt Chart. Use the Format tab to change your text boxes' font styles, colors, alignment, and borders. And on the insert tab, there are elements that you can use, like images and shapes.
Next, we will now add milestones to your Gantt Chart. Right-click on the taskbar, select the Insert Task, then choose Milestone. There, you can modify your Milestone and add additional features to it.
And then, add bars to your Gantt Chart by clicking the Bars tab in the Ribbon icon. You will see two kinds of bars: Task (or Start) and Duration (or Finish).
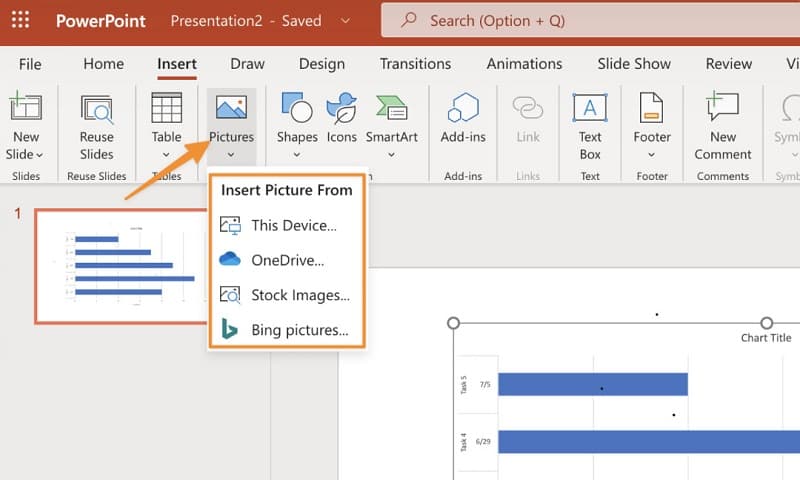
And finally, we will add Graphics to your Gantt Chart to add some spark. Use some images of people or icons that represent each of the tasks listed on your Gantt Chart. By doing this, you can make your project more appealing.
And that’s how to do a Gantt Chart in PowerPoint. Just follow these steps, and you can create your own Gantt Chart.
Part 3. Pros and Cons of Using PowerPoint to Make a Gantt Chart
Below are the advantages and disadvantages of using PowerPoint to create a Gantt Chart.
PROS
- You can create your Gantt Chart easily with its simple user interface.
- You can design and customize the taskbars.
- You can use other templates.
- PowerPoint is supported by all operating systems, like Windows and Mac.
- You can add images and shapes to enhance your project.
CONS
- You first need to make your data from excel before making a Gantt Chart in PowerPoint.
- You first need to upload a template before creating a Gantt Chart.
Part 4. FAQs about How to Create Gantt Chart in PowerPoint
Can I create a project timeline using PowerPoint?
Yes. With Microsoft PowerPoint, you can create a fantastic Project Timeline that you can use for managing your tasks concerning your due dates.
Is it better to create a Gantt Chart in Excel or PowerPoint?
It is better and easier to create a Gantt Chart in Microsoft Excel because with Microsoft Excel, you can easily make your Gantt Chart using the Tool’s bar chart.
What are the three things you need to include in your Gantt Chart?
The essential elements your Gantt Chart must have are the activities or tasks (left axis), the milestones (top or bottom axis), and the taskbars.
Conclusion
It is not complicated to build a Gantt Chart in PowerPoint; by following the provided steps above, you can easily make your own Gantt Chart using Microsoft PowerPoint. However, Microsoft PowerPoint does not have ready-made templates that you can use for your Gantt Chart, and you first need to use Excel for your data. But if you want to make a project management plan online, MindOnMap is the best tool to use.