2 Ways about How to Make a Gantt Chart on Your Computer
If you are busy and want to manage your activities or projects professionally, Gantt Charts can help you organize your projects concerning the dates you want them to do. With Gantt Charts, you can see the timeline and the status of your projects and who is responsible for each task. Moreover, you will also see how long each task will take and what work is in progress. In short, Gantt Chart is a simple way to communicate what it takes to complete a task on time and within budget. However, if you don't have knowledge about how to create a Gantt Chart, do not worry. In these blog posts, we will show and discuss how to make a Gantt Chart offline and online.

- Part 1. How to Make a Gantt Chart Offline
- Part 2. How to Make a Gantt Chart Online
- Part 3. Recommendation: Chart Maker
- Part 4. FAQs about How to Make a Gantt Chart
Part 1. How to Make a Gantt Chart Offline
Gantt Charts are a series of horizontal lines showing your work progress and the tasks completed in a certain period. Also, it helps teams to work and plan their deadlines and allocate their resources well. It also enables users to know the priorities of their goals and plans.
TeamGantt is the most notorious Gantt Chart maker you can download on your desktop. It is downloadable on almost all operating systems, like Windows and Mac. This offline application enables you to manage your projects or tasks like a pro. TeamGantt allows you to schedule tasks and projects using schedules, tasks, timelines, kanban boards, and workloads that you can work with your teams. Moreover, TeamGantt has an easy-to-use interface where you can drag and drop objects that you will use for your Gantt Chart. With this offline application, you can manage your work efficiently and resourcefully.
Furthermore, you can start managing efficient projects with its Workload Management feature. It is a useful feature where you can see what every user, resource, or team member is working on. So, if you are interested in using this application to create a Gantt Chart, refer to the instructions below. However, you must purchase the app before using the special features.
How to create a Gantt Chart using TeamGantt
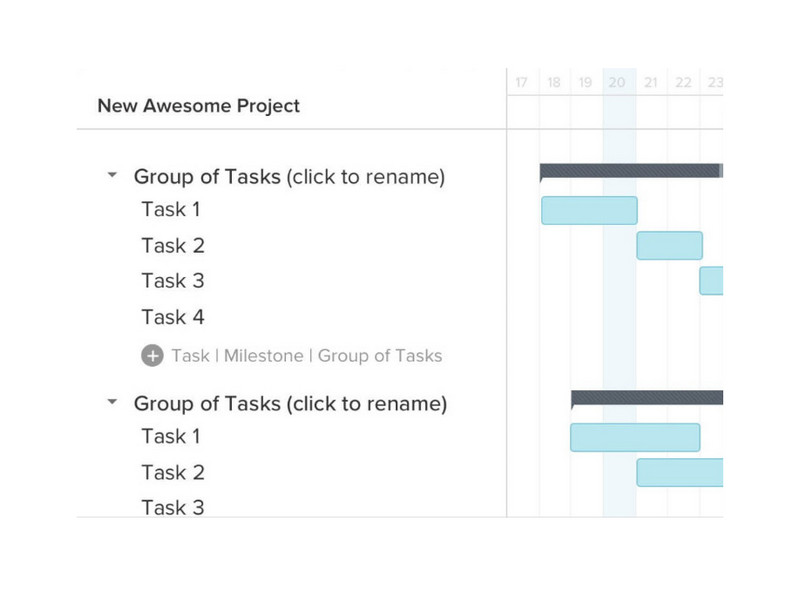
Before mapping out your tasks on a timeline, you must create project details. Create a new project by clicking the New Project button in the interface's upper right corner. And then, type the name that you want your project to have. Also, select the days of the week you wish to include in your Gantt Chart.
Next, we will now add a task to your project. First, create your project timeline by clicking the Add Task link (+Task) and typing the name for your first task. Press enter to add another task. Repeat this process until you have listed all of the tasks that you need to do.
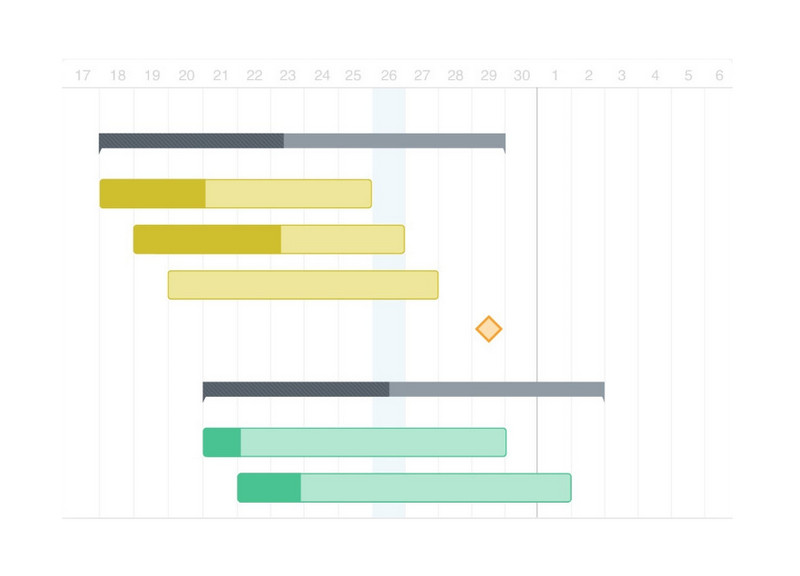
Now that you have your complete list, you will schedule all the tasks that need to be done. To create and add the taskbar on your Gantt Chart, click the Timeline below the dates you want to schedule your tasks.
After adding milestones to your Gantt Chart, click the Milestone link and type a name for your Milestone. Then, drag the Milestone icon across your Gantt Chart to schedule your task on the Timeline. Note that in TeamGantt, the Milestones appear in a yellow diamond.
Next, add dependencies to the task that needs them. Move your cursor to a task and click the gray dot that will appear. Hit the dependency line to the task you want to link.
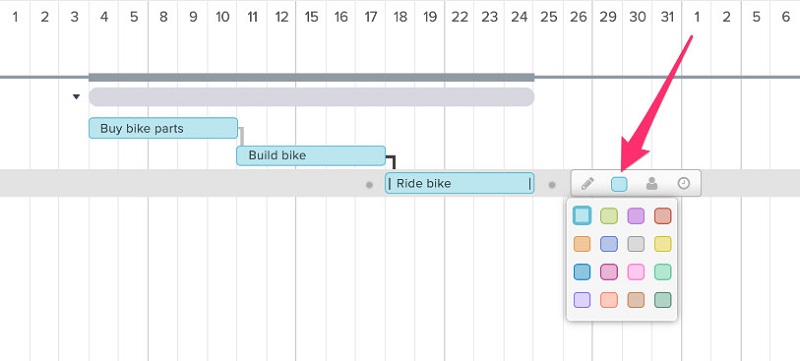
Finally, apply color to your tasks to enhance your Gantt Chart and make it look professionally. Hover your cursor over the taskbar, and select the color you prefer for your taskbars. Click here to get how to make gantt charts in Excel.
Part 2. How to Make a Gantt Chart Online
Without a good Gantt Chart maker, it will be hard for you to create and present a Gantt Chart to others. There are online Gantt Chart makers that you can access on your browser. And fortunately, we found the best online Gantt Chart maker you can use on your browser. If you desire to learn how to make a Gantt Chart online, refer to the steps below.
EdrawMax online is an online Gantt Chart maker that you can access on your browser. It has an intuitive user interface, which makes it a user-friendly tool. This app has ready-made templates and frees editable Gantt Chart examples that you can use to create Gantt Charts. But you need to sign-up for an account to use this application. And since it is an online tool, it sometimes has a slow loading process. Nonetheless, it’s still a good app for creating Gantt Charts.
How to build a Gantt Chart using EdrawMax online
Log in or sign up for your EdrawMax account. Go to Project Management on the left side of the diagram, then click the plus icon.
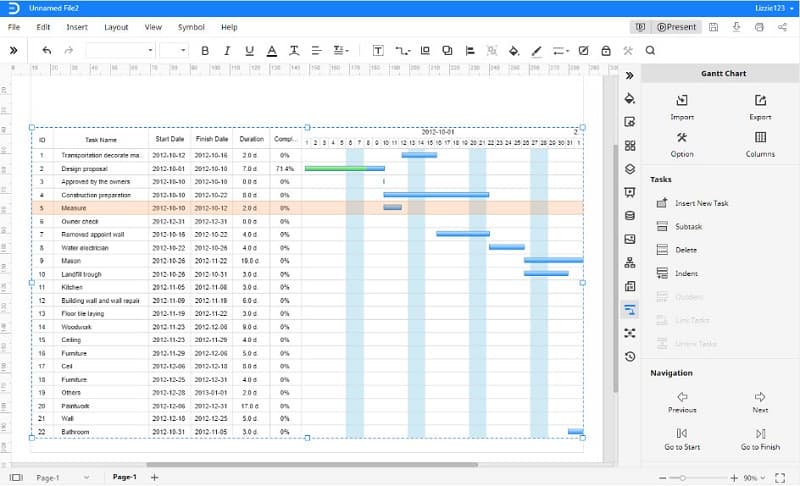
Click the Import button to add the data files. And then click OK. After that, you will see that EdraMax will auto-generate a Gantt Chart.
Click the target task, and click on the Subtask option. A new subtask will appear under the selected task.
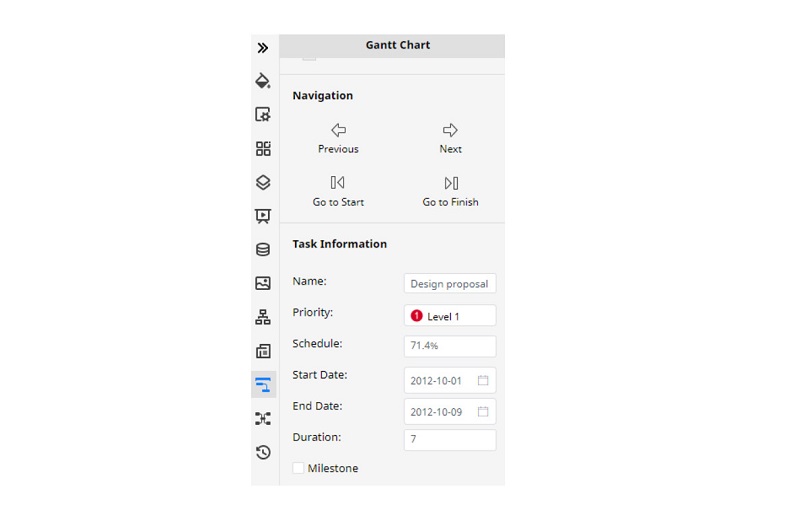
And finally, you can modify the task information by scrolling at the bottom of the interface. You will see the task's basic information, like the task name, priority, completion percentage, start and finish date, and Milestone.
Part 3. Recommendation: Chart Maker
You can also try creating a chart with this perfect online chart maker. MindOnMap is a fantastic tool that you can use to create charts and diagrams for project planning. It also has ready-made templates and layouts that you can use for project management. In addition, you can add shapes, icons, and figures to enhance your chart. If you want to know how to create a project management chart, follow the instructions provided below.
Secure Download
Secure Download
On your browser access MindOnMap by searching it on your browser. And then log in or sign-up for your account. Click the Create Your Mind Map button on the software's main interface.

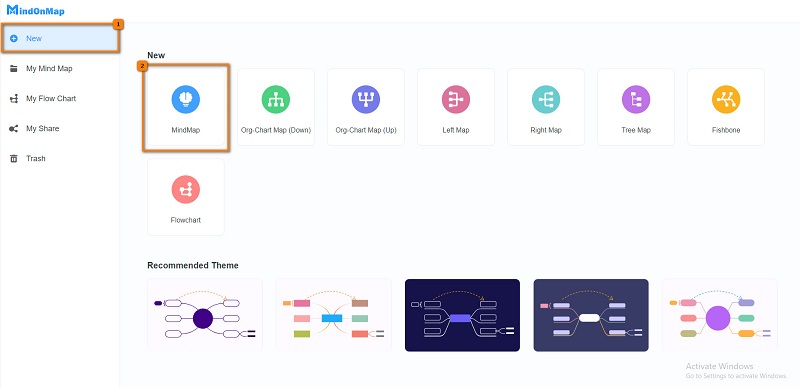
Then, click the New button on the app’s dashboard and select the MindMap option.
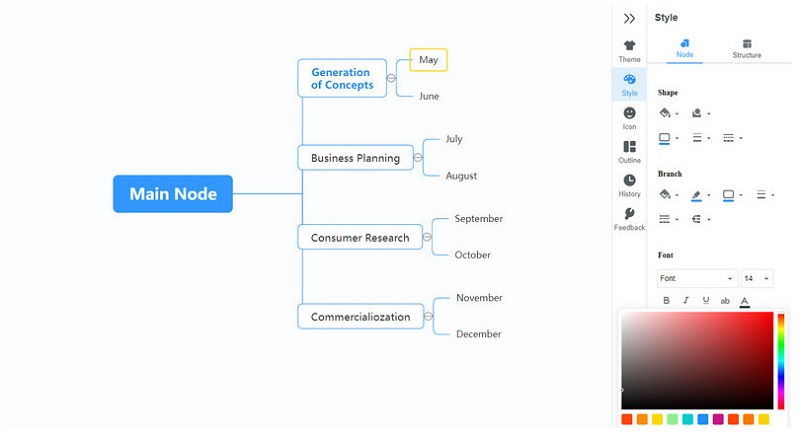
And on the following interface, you will see the Main Node and hit Tab on your keyboard to add Nodes. Double-click the branch that you want to edit.
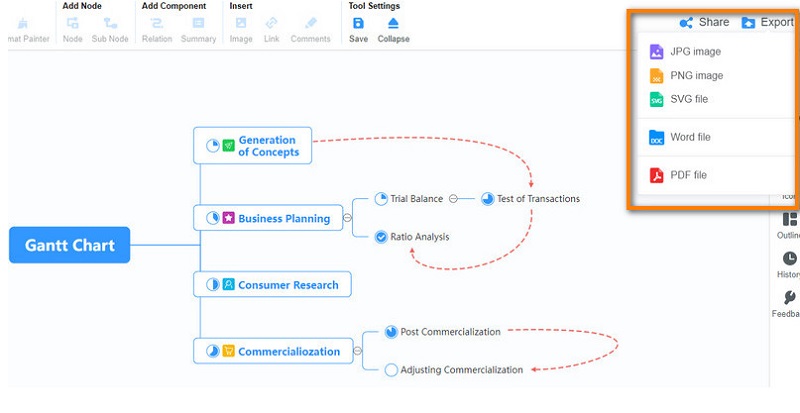
And for the last step, click the Export button to save your project. You can select what type of format you want your chart to have. You can also share the link by clicking the Save button and Copy Link.
Part 4. FAQs about How to Make a Gantt Chart
Can I add a Gantt Chart in Microsoft Excel?
Yes. You can import Gantt Charts in Microsoft Excel. Click File > Open. Then select the Gantt Chart file from your computer files.
Is there a Gantt Chart template in Microsoft Word?
Yes. In Microsoft Word, you can create a Gantt Chart by using the Gantt Chart templates. Click the Insert tab, then click the Chart. A new window will prompt where you select the Column option and click the Stacked Bar.
What is dependency in Gantt Chart?
The dependency in Gantt Chart is also referred to as task dependency. It is the relationship between one task to another.
Conclusion
In this article, you will easily learn how to make a Gantt Chart. Whatever methods you choose among the ways we present above, you can create a Gantt Chart amazingly. But if you prefer using an easier way to create charts, many people recommend using MindOnMap.