How to Create an Amazing and Effective Gantt Chart in Excel
One of the most used and versatile tools nowadays is Microsoft Excel. It is spreadsheet software that is a command default project management tool for teams that use the Microsoft Office suite. As your business continues to nourish, you need a more complex and versatile tool to manage your projects or activities that need to be done. And luckily, Microsoft Excel is software that you can use to make a Gantt Chart. In these write-ups, we will teach you the detailed steps to create a Gantt Chart on Excel.

- Part 1. Steps on How to Make a Gantt Chart in Excel
- Part 2. Pros and Cons of Using Excel to Create a Gantt Chart
- Part 3. Bonus: Free Online Chart Maker
- Part 4. FAQs about How to Make a Gantt Chart in Excel
Part 1. Steps on How to Make a Gantt Chart in Excel
A Gantt Chart is a project management method that can help you visualize your project's timeline at a glance. Based on your chart, it is a list you need to accomplish in a given time. In addition, it consists of a left column where your projects are listed, and in the top row are the dates where each project or activity is assigned. Many professionals and business people use Gantt Charts to manage their time well. And if you also want to create a Gantt Chart, then you can use Microsoft Excel to create one.
Microsoft Excel is a spreadsheet program for organizing numbers and data in formulas and functions. It is also a component of the Microsoft Office product group for business software. With Microsoft Excel, you can format, organize, and calculate data in a spreadsheet. Moreover, this Gantt chart creator is widely used for business analysis, operations management and performance reporting, school human resource management, and many more.
And did you know? With Microsoft Excel, you can also create your own Gantt Chart professionally. Although it’s not easy to create one, we will show you simple steps. Therefore, read the following part to learn how to make a Gantt Chart in Excel.
How to do a Gantt Chart using Microsoft Excel
Download Microsoft Excel
To begin, download Microsoft Excel on your desktop if it is not yet installed on your device. And then, install it and open it.
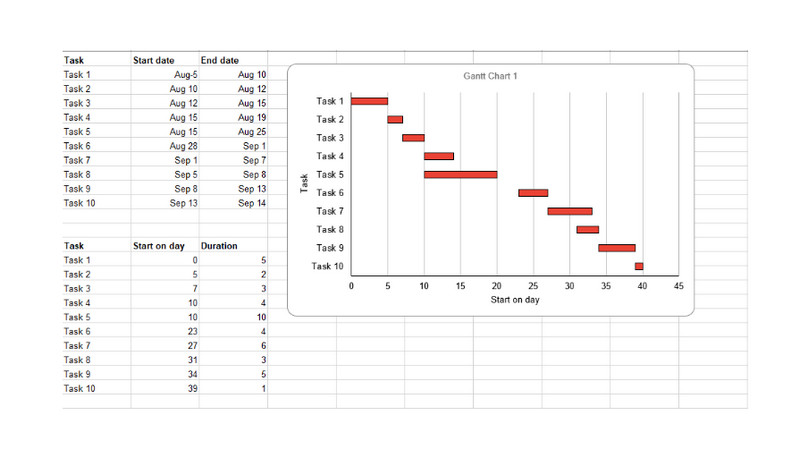
Create Your Own Project Table
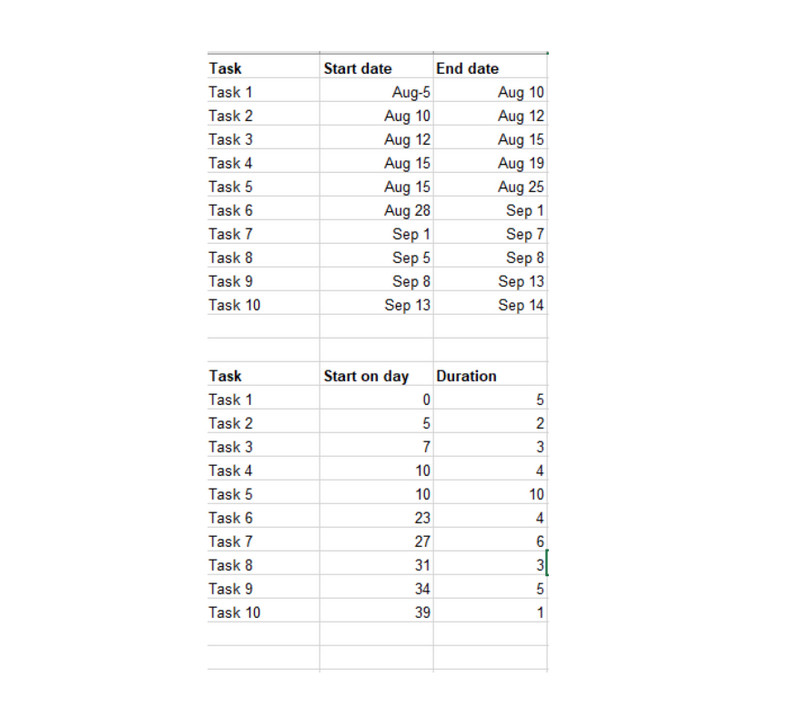
Enter your project information into the spreadsheet. Then, list the project tasks on the farthest left column, with one row per task. You can also manually input the duration of your tasks or use the following Excel formulas below to fill the cells automatically.
End date - Start date = Duration
End date - Start date + 1 = Duration
For example, if your start date is column B, the end date is column C, and your Duration on column D, then the formula in cell D2 will be C2-B2+1.
But if you have a task and know how long it will take for you to complete it, you can enter the End date and the Duration and find the best Start date by using this formula:
End Date - Duration = Start Date
Create an Excel Bar Chart
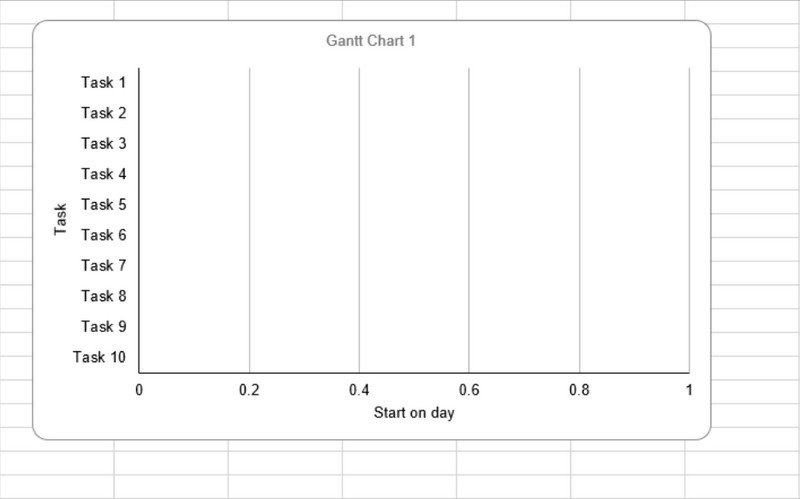
To visualize your data, you first need to create a bar chart from the spreadsheet in Excel. To do this:
1. Select the Start date column to highlight it.
2. Under the Insert panel, click the Chart option, then Stacked Bar.
By doing these commands, you can create a stacked bar chart with horizontal bars from the left and the start dates as the x-axis. Here is an example below.
Insert Your Duration Data
Add another series to your chart for the next step to reflect your task duration. Here are the steps on how to insert your duration data.
1. Right-click the chart, and tick Select data from the Menu.
2. The Select data source window will prompt with the Start date listed as a series.
3. And then, click the Add button under the Legend entries (series), and the Edit series window will open.
4. Type Duration to name your series.
5. Beside the Series value, click the icon next to it to open the Edit series window.
6. When the Edit series window is opened, select the cells in the Duration column, except the header and the empty cells. You can also fill the Series values field with this formula:
=’[TABLE NAME]’!$[COLUMN]$[ROW]:$[COLUMN]$[ROW]. For example: =’New Project’!$D$2:$D$17
7. Once you’ve filled in the series name and value, click OK to close the window.
8. Lastly, you will see the Data Source window again, but now, with the Duration added as a series. Click the OK button to add the series to your chart.
Add Task Descriptions
Open the Select data source window again to reflect your chart’s task names instead of brown numbers.
1. Right-click the chart to prompt the Select data source window.
2. Click Start date on the left side of the Series list and click Edit on the right Category list.
3. When the Axis label window opens, select the cells in the Start date column.
4. Click OK on the Axis labels window and select the data source window to add the information to your chart.
Turn it Into Gantt Chart
Remove the portion from each bar representing the Start date, except the portion representing the task duration.
1. Click any bar from the chart. With all the bars selected, right-click and choose the Format data series from the Menu.
2. And then, under Fill, click the No fill.
3. And under the Border color, select the No line option.
Now, we will fix the order of your activities/tasks.
1. Click the list of activities on the left side of your chart and open the Format axis window.
2. Under the Axis options, click Categories in reverse order.
3. Tick the Close button to close the window and save changes to your chart.
And those are the simple steps on how to create a Gantt Chart in Excel.
Part 2. Pros and Cons of Using Excel to Create a Gantt Chart
PROS
- You can create your Gantt Chart manually and by using formulas.
- You can download Microsoft Excel on all operating systems.
- You can manually enter the duration of your tasks.
CONS
- You need in-depth knowledge to make a Gantt Chart using Excel.
- You cannot design or put icons for emphasis.
Part 3. Bonus: Free Online Chart Maker
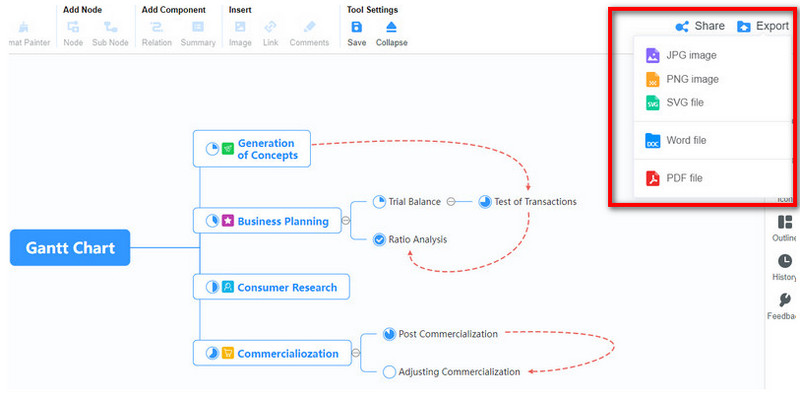
MindOnMap is the best alternative for making various charts and diagrams. With MindOnMap, you can create charts for free without worrying about their safety. MindOnMap comes with tons of map layouts with shapes, icons, emojis, and other figures to style your chart. You can make various charts using MindOnMap, like organizational charts, tree maps, fishbone, flowcharts, and more. Additionally, you can export your work in different formats, such as PNG, JPEG, JPG, SVG, and PDF.
Secure Download
Secure Download
How to use MindOnMap
Access MindOnMap
Search MindOnMap on your browser, or click this link to access the software immediately.
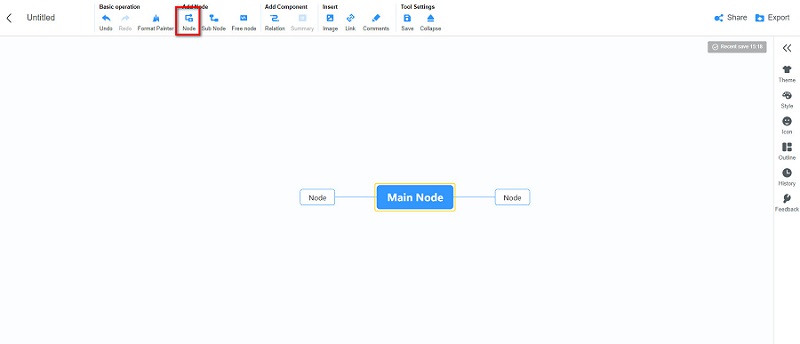
Now, click the New button and select the MindMap option.

And on the following interface, select the Central Node and hit Tab on your keyboard to add branches. You can also click the Node option to add branches.
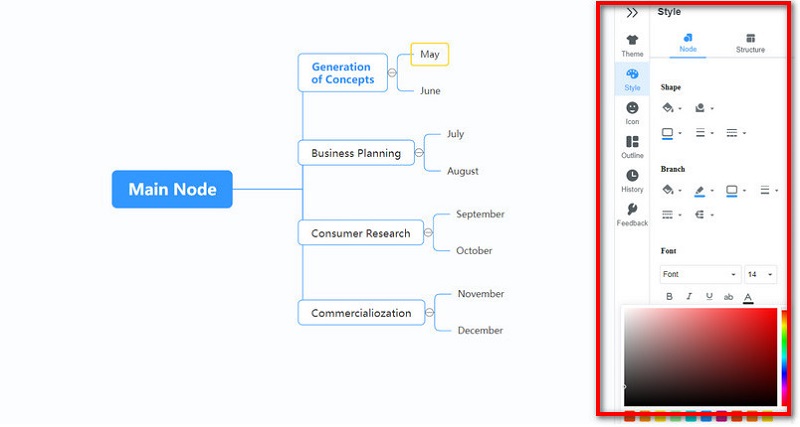
And then, add more nodes and the information you need for your map. You can customize the style, color, and alignment of your Nodes from the Style section panel.
Press the Export button and select the file format that you prefer for your map.
Further Reading
Part 4. FAQs about How to Make a Gantt Chart in Excel
What are the alternatives for Gantt Chart?
You can always use other tools for creating project schedules. And Gantt Charts always come with disadvantages. Therefore, you can use other tools, like scrum boards, whiteboards, and timelines, to manage your time and projects.
Are there Gantt Chart templates in Microsoft Excel?
Yes. There are professional-looking Gantt Chart templates made by Vertex42.com, the leading designer of Excel spreadsheets.
Which Microsoft program is the best for creating Gantt Charts?
Microsoft Excel is the leading program Microsoft for creating simple Gantt Charts. Many professionals also use Excel to create Gantt Charts.
Conclusion
Business owners and project managers often use Gantt Charts to keep track of their activity schedules. Perhaps you are searching for the best tool to create Gantt Charts; you can use Microsoft Excel to do so. And in this article, we provided all the essential steps on how to build a Gantt Chart in Excel. But if you prefer a more straightforward tool to create amazing charts, use MindOnMap on your browser.