Gantt Chart: Definition, Advantage in Using it, and How to Use
If you need help properly scheduling, managing, and monitoring tasks or projects, you can use Gantt Chart to organize them. If you are unfamiliar with Gantt Chart, we will discuss with you all the necessary pieces of information that you need about Gantt Chart. By reading this post, you will know the benefits and what is a Gantt Chart.

- Part 1. What is a Gantt Chart
- Part 2. What Gantt Chart is Used for
- Part 3. Gantt Chart Alternatives
- Part 4. Gantt Chart Makers
- Part 5. FAQs about What is a Gantt Chart
Part 1. What is a Gantt Chart
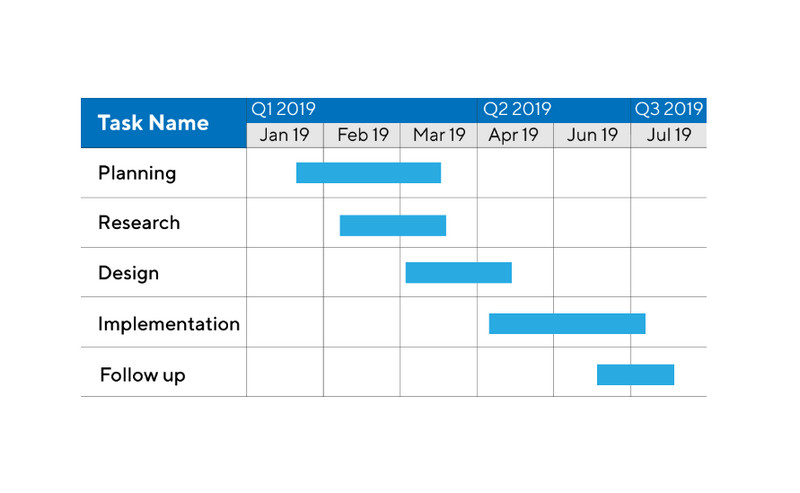
Gantt Charts are commonly used in project management and are one of the most used graphic charts in presenting activities. Gantt Charts are widely used for projects in heavy industries, such as building dams, roads, highways, and bridges. It is also commonly used in software development and buildings. Many companies and business owners also use this visualization to plan their goals. But what does a Gantt Chart look like? A Gantt Chart consists of horizontal bars with different lengths, representing the project's timeline, including task sequences, duration, and the beginning and end dates each task is due. The horizontal bars also show how much the task is being done.
Moreover, Gantt Chart shows the project timeline to monitor and schedule the plans and tasks you need to accomplish over time. And you will see on the left side of the Gantt Chart the list of activities you will do, and at the top of the Gantt Chart is the time scale. In short, Gantt Chart is a table or representation that shows you what needs to be done on a specific date or time depending on your schedule.
Now that you know the Gantt Chart definition, let’s now understand what Gantt Chart is used for.
Part 2. What Gantt Chart is Used for
Gantt charts are always used in different industries; even students use this chart. Even a century after the Gantt Chart was introduced, it is still widely used and essential to many people. In 1999, Gantt Chart was one of the most used management tools for project scheduling and control. Its interface is straightforward, where the vertical axis is where you can find the tasks, while the activity, time intervals, and duration appear on the horizontal axis. Gantt Charts are usually used in construction, consulting, marketing, manufacturing, HR, software development, and event planning. Some significant benefits of using Gantt Charts are that it can identify tasks you can do in parallel and the activities that can’t be started or finished until other scheduled tasks are completed.
Furthermore, Gantt Chart prevents potential bottlenecks and identifies the tasks excluded from the project timeline. It also identifies slack task time or additional time for completing a task that must not delay the project and critical tasks that must be executed in due time. Gantt charts are also great representational charts for managing big projects of all sizes and types. Using a Gantt Chart, you will also know what you must prioritize before doing the other tasks. Although Gantt Chart may vary in complexity and depth, it always has these three components:
◆ Activities or tasks that need to be done on the y-axis.
◆ The progress of your activities along the x-axis (either the top or the bottom of the chart).
◆ The progress bars are represented by the horizontal bars, which denote how long each task is scheduled at a given point.
Part 3. Gantt Chart Alternatives
If you do not desire to use a Gantt Chart, there are also alternatives that you can use to schedule your tasks or activities.
1. Lists
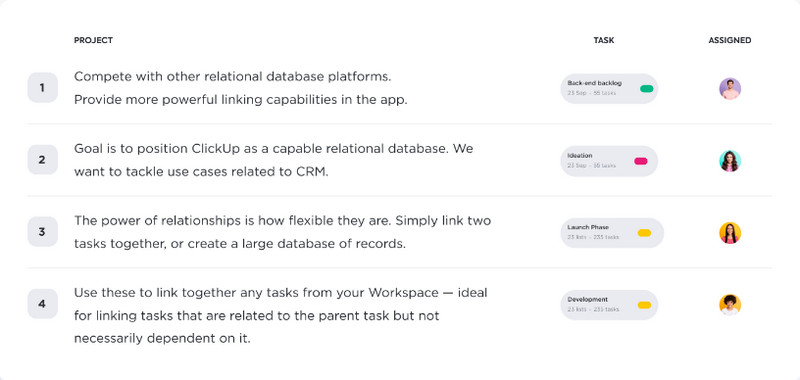
Lists are versatile and can be used to create a work breakdown structure. They are typically the go-to method when you need the team to prioritize the task priorities. Additionally, you can immediately change the list to reflect the most critical information needed to stay on your path. Despite the differences, lists are similar to Gantt Charts; they are not one-size-fits-all project management tools. However, if you need to track the dependencies for your project, lists are not the preferable tool to use.
2. Kanban Boards
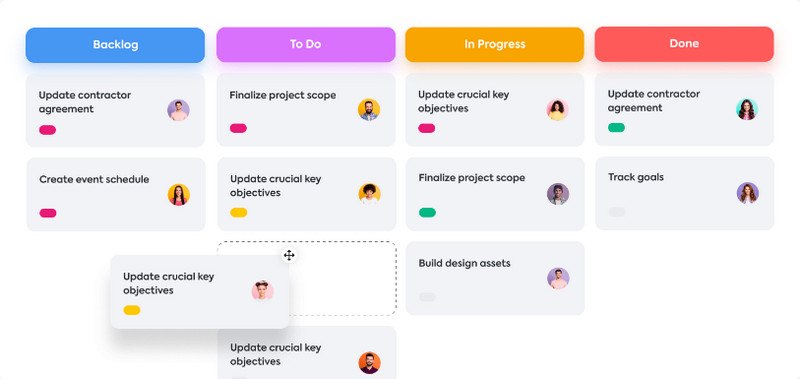
Kanban Boards is the best representation that shows a visual pipeline for keeping your tasks on track. It is a method used for projects that do not need prioritization of dependency strategies. But the good thing about using this method is that it can help you limit your work in progress per workflow status. Kanban Boards contains a card (which represents the task) that moves through every column (representing the workflow status) from left to right until it reaches the DONE status. Moreover, Kanban Boards are good for managing these projects: Performing maintenance requests, creating social media content, managing a sales funnel, interviewing candidates, and tracking inventory.
3. Timeline
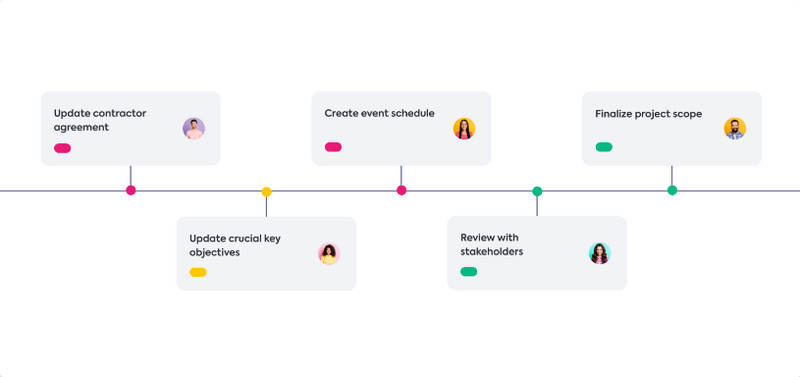
With Timeline, you can capture all tasks in sequential order. This method may look very similar to Gantt Charts, but you can differentiate by their dependency on a two-dimensional chart. A timeline shows the chronological order of tasks or deadlines that you need to do. In addition, the Timeline is straightforward to do compared to other time management charts. If you want to present a brief overview of your project’s life cycle, you can use Timeline to show it.
4. Whiteboards
Whiteboards are the best tool if you have brainstorming sessions to work with your team more efficiently. If you are constructing ideas and plans for your business, Whiteboard is a must-to-use tool. Moreover, physical whiteboards are very useful in an office setting, especially when you want to implement quick problem-solving between the individuals in your office. And as Zab Evans, CEO of ClickUp, stated, “Whiteboards are crucial for team collaboration even as companies transition to remote or hybrid working settings. The emergence of collaborative whiteboard solutions fills the gap in how distant teams discuss and generate ideas. Given that the global market for interactive whiteboards is anticipated to reach $2.31 billion by 2025, it is obvious how widely used these products are.”
5. Scrum Boards
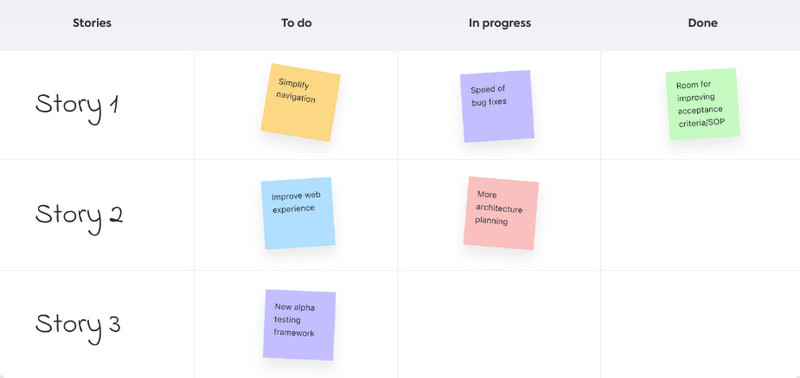
If you have immediate problems that you need to solve, Scrum Boards is the best tool to use. Scrum Boards, also known as Sprint Boards, are a visual representation of the activity that needs to be done immediately. With Scrum Boards, you can improve the efficiency and communication of your team because it ensures that everyone is working on a task assigned to each person. Moreover, it can identify the tasks that need to be completed and keep track of an active sprint project. Scrum Boards list the To-do, In progress, and Done projects
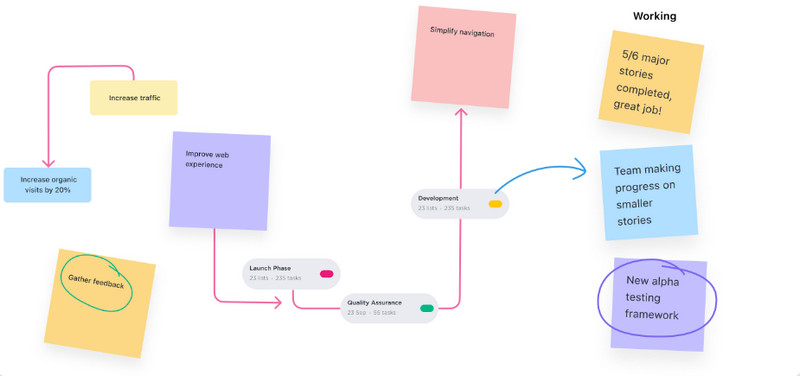
6. Mind Maps
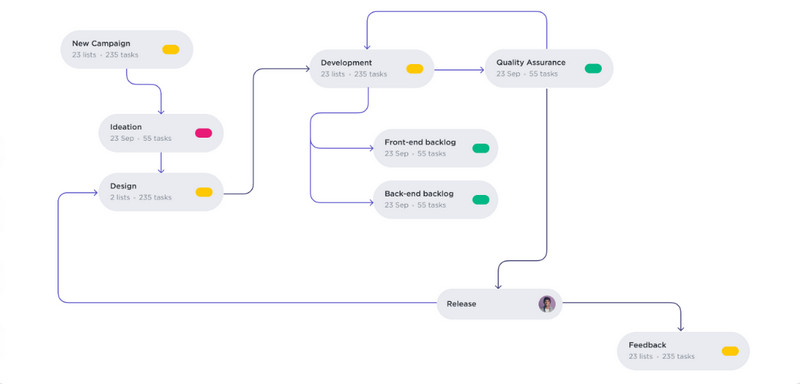
Mind Maps or Project Network Diagrams are among the best alternatives for Gantt Charts. It is the ideal tool for brainstorming and project planning. In the center of a mind map, you will see the main topic or the central idea. And from the central idea, lines are drawn to connect to other related ideas, which goes on and on. Mind maps are great for brainstorming as everyone can generate their ideas without worrying about being tangled up. You can draw a mind map using software or a piece of paper. Also, many business people use this tool to plan for their projects and goals.
Part 4. Gantt Chart Makers
There are tons of tools that you can use to create a Gantt Chart. But if you want to use a convenient tool, we know the best application that you can use. You can use online tools to create a simple Gantt Chart. Many people prefer using online tools because it allows them to save space on their devices.
1. TeamGantt
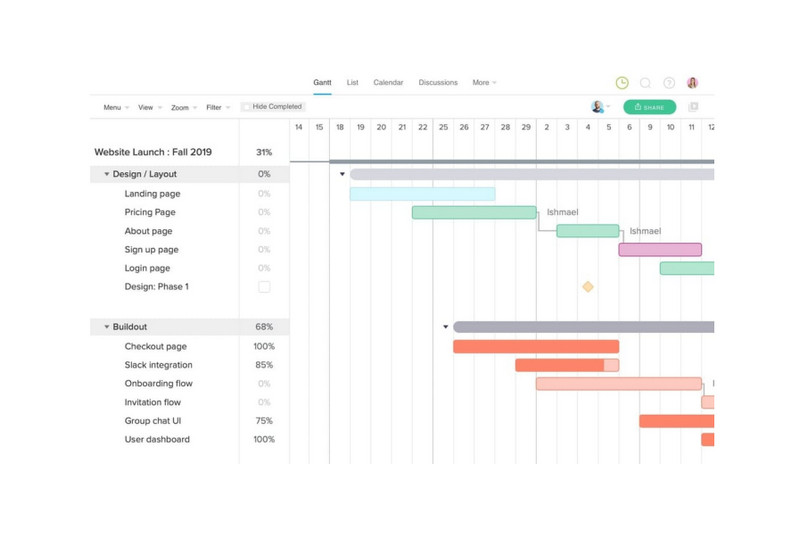
TeamGantt is listed among the best software for creating Gantt Charts. Gantt Chart is online software you can use on all web browsers, such as Google and Safari. This tool enables users to visualize and create project plans that they can update wherever they are.Additionally, this Gantt chart maker has an easy-to-use interface, which makes it a user-friendly tool. Its simple drag-and-drop platform allows teams to communicate and update project progress in real-time. With TeamGantt, teams can plan faster, resource more efficiently, and manage schedules easily.Furthermore, it is an impressive tool for keeping up with project deadlines and activities. TeamGantt also has a feature where teams can keep tabs on all projects from a single screen, called the portfolio view. However, TeamGantt is not free to use. You need to purchase it based on the plan preference you like.
2. Instagantt
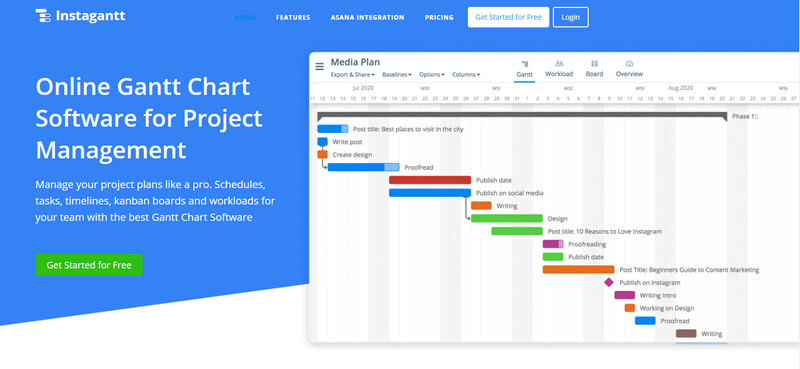
If you want to create a Gantt Chart online, Instagantt is a great tool to use. Instagantt offers an impressive way to create a Gantt Chart. It has an intuitive user interface, and just like the tool above, it is a user-friendly tool. And lately, Instagantt added the benefit of seamless integration, which allows the tool to integrate with other well-known platforms, like Asana. In addition, this tool can help you greatly to simplify things without adding many features to create a Gantt Chart. A setback of this tool is that you may experience a slow loading process since it is an online tool.
Recommendation: Chart Maker - MindOnMap
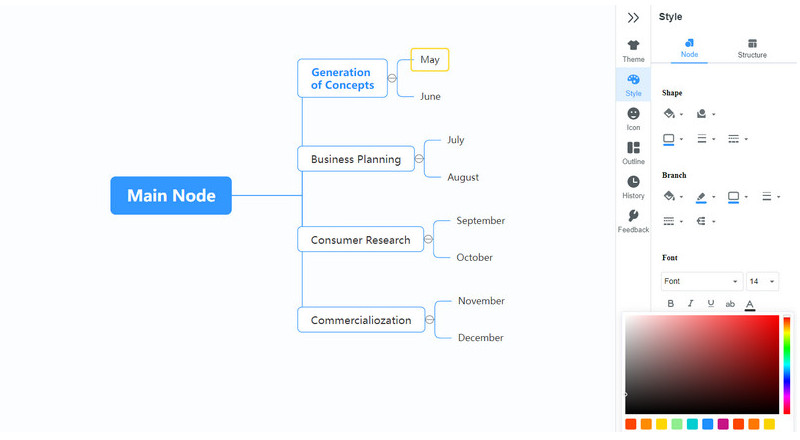
Before using other Gantt Chart maker tools, you can easily use MindOnMap to make charts. MindOnMap is also an online tool that you can use to create mind maps, charts, and diagrams. MindOnMap is initially a Mind Mapping tool, but the good thing about it is that it has many features and mind mapping diagrams that you can use for different purposes. This tool can create Charts, Org charts, Venn Diagrams, Swim Lane Diagrams, and more. It also has free-made templates that you can use for free.
Furthermore, MindOnMap is free and safe to use. Using the symbol indicators, you can also use icons, flags, and symbol icons to make your chart clearer. This online tool also allows you to export your project in PNG, JPG, SVG, PDF, and more formats.
Secure Download
Secure Download
Part 5. FAQs about What is a Gantt Chart
What are the seven important elements of a Gantt Chart?
Here are the seven basic elements of a Gantt Chart:
◆ Lists of tasks needed for a project.
◆ Start date and end date of every task.
◆ The progress made in the completion of the task.
◆ The dependencies that are linked to the task.
Start and end date of the project’s timeline.
◆ Important milestone dates.
◆ Your project’s critical and most important task.
Why is it called the Gantt Chart?
The Gantt Chart was named after Henry Gantt (1861-1919). He created this Chart for systematic and routine operations.
Can I create a Gantt Chart using Canva?
Yes. Canva allows you to create your amazing Gantt Chart without needing to learn complicated software. With Canva, you can create Gantt Charts online.
Conclusion
Gantt Charts are amazing ways to manage projects and for scheduling your activities. By reading this article, you will learn all the necessary things about Gantt Charts and what are the best tools for creating one. But if you are searching for an online application that enables you to create different charts, use MindOnMap now.