Learn How to Create a Gantt Chart for Project Management
Perhaps you are having difficulty managing your time on the activities that you have in a month or a week. Not managing your time well can cause stress, exhaustion, or impulse on the things you need to do. Luckily, there is a way you can manage your projects and time well. Gantt Charts are one of the most valuable techniques that you can use for project management. It is a popular tool when planning your activities within a certain period. So, if you want to learn the easy steps to create a Gantt Chart for project management, read this guidepost comprehensively.

- Part 1. What is Gantt Chart in Project Management
- Part 2. Benefits of Making a Gantt Chart for Project Management
- Part 3. How to Make a Gantt Chart for Project Management
- Part 4. Recommendation: Chart Maker
- Part 5. FAQs about How to Make a Gantt Chart for Project Management
Part 1. What is Gantt Chart in Project Management
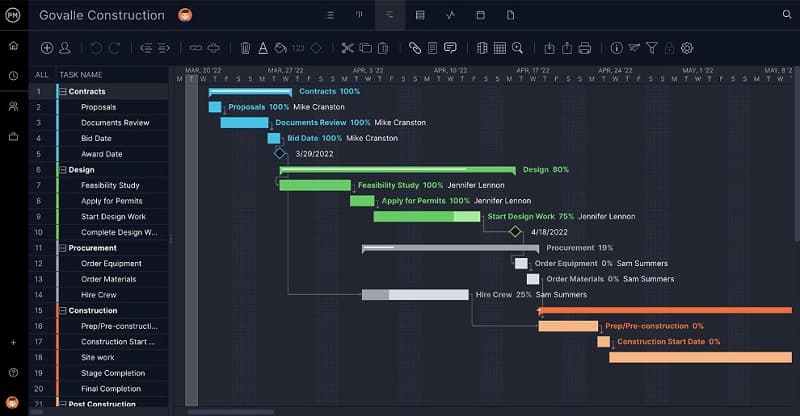
As mentioned above, Gantt Chart is a project management tool that visually represents what needs to be finished and when it will be accomplished. With the use of a Gantt Chart, you can also weigh down the heaviest or most necessary work you need to prioritize. Gantt Charts are excellent tools for project management because you can see your tracking projects and help you with the interdependencies between your activities or tasks. Moreover, Gantt Charts can be used to show the progress of your goals, resources, constraints, and other scheduling information that needs to be done. Gantt Chart has many more benefits when it comes to project management. With it, you can let your team members view the relationship between their work and with others. Furthermore, you can break down your tasks or projects into more manageable chunks.
Part 2. Benefits of Making a Gantt Chart for Project Management
Now that you know what Gantt Chart is in project management, we will not discuss the benefits of using this tool. Using a Gantt Chart for project management allows you to:
◆ Break down tasks into more manageable chunks.
◆ Monitor the progress of your activities.
◆ Allow your team members to view their work relationships with others.
◆ Identify the most crucial part of the project.
◆ See constraints and conflicts.
◆ Allows you to view task dependencies and relations.
Part 3. How to Make a Gantt Chart for Project Management
There are a couple of applications to make your Gantt Chart. If you are a traditional project manager, you can grab a pencil and a piece of paper and start mapping out your Gantt Chart. That might be an excellent way to start your Gantt Chart. But with all the changes and adjustments you need to create, it would be better to use applications or templates on your computer. But before proceeding with the Gantt chart creator, we will first demonstrate how to create a project with Gantt Chart.
Steps to Make a Gantt Chart for Project Management
Make Your Task List
Before creating your Gantt Chart and mapping out the work you need to list, you first need to make the list of your tasks to be effective. Professionals advise using the work breakdown structure to make your work list. Work Breakdown Structure allows you to break down large and complex projects in a simpler and easier way.
Write Your Task’s Start and End Dates
In this step, we will begin writing the task sequence over your project timeline. It is possible to have a task that has the same start and end dates but will be performed by different team members. When placing task dates, you must make a time estimation of when the task will be completed. The duration of your task is determined between the start and end date of your projects. Now, you no longer have the task list; you now have the visual representation of your project on a timeline.
Add Milestones
Milestones are points you put within your timeline to help you keep track of important tasks. You must add these milestones to mark your projects' completed tasks in deliverable works spaces. Having a milestone on your Gantt Chart can boost your team’s morale to see that you finished the critical tasks that you set.
Identify Your Task Dependencies
Some tasks can be done at the same time. However, other tasks can’t be started until the other task is finished. These are what you call task dependencies. Once you have identified your task dependencies, you can create your Gantt Chart by linking the related tasks.
Assign Projects to Your Team
Once you’ve listed all the tasks, milestones, durations, and dependencies needed for your Gantt Chart, you can start assigning your task to your team members.
Part 4. Recommendation: Chart Maker
If you do not know what application to use for creating Gantt Charts, then worry no more. There are only a few applications that can help you create your Gantt Chart on your PC. Fortunately, we found the best application where you can create your Gantt Chart.
MindOnMap is the best and leading diagram maker that you can use online. MindOnMap contains many shapes and templates that you can use for creating Gantt Charts. This online diagram maker can help you make a Gantt Chart excellently. Also, this online tool allows you to make a Gantt Chart using its Flowchart option. You can also add unique icons, emojis, and symbols that can flavor your project. MindOnMap is also a user-friendly application because it has an easy-to-use interface. You can also use its ready-made templates, which are built-in and free to use. Moreover, it supports the most used file formats, such as PNG, JPEG, SVG, Word document, and PDF. Plus, it is accessible on all leading web browsers, including Google, Firefox, and Safari. So, if you want to use MindOnMap to create an amazing Gantt Chart, follow the simple instructions below.
Secure Download
Secure Download
How to make a project Gantt Chart using MindOnMap
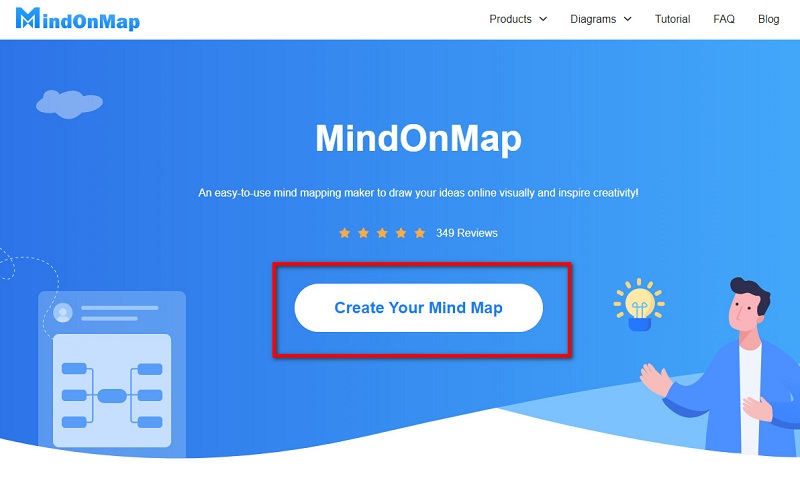
Access MindOnMap by clicking the link or searching MindOnMap in your search box. Then, click the Create Your Mind Map button on the main user interface.
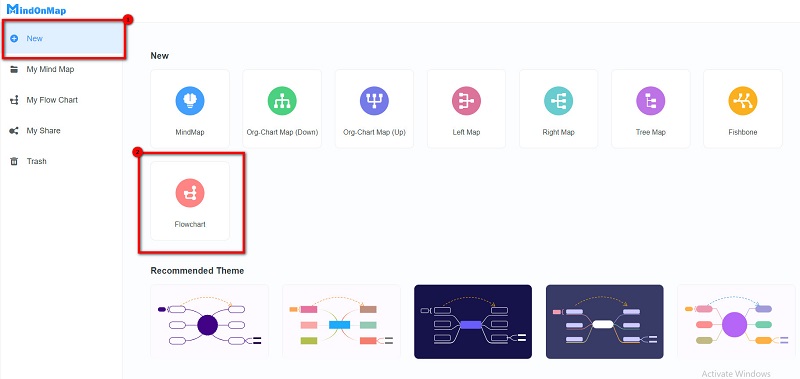
Click the New button, and select the Flowchart option where you will create your Gantt Chart.
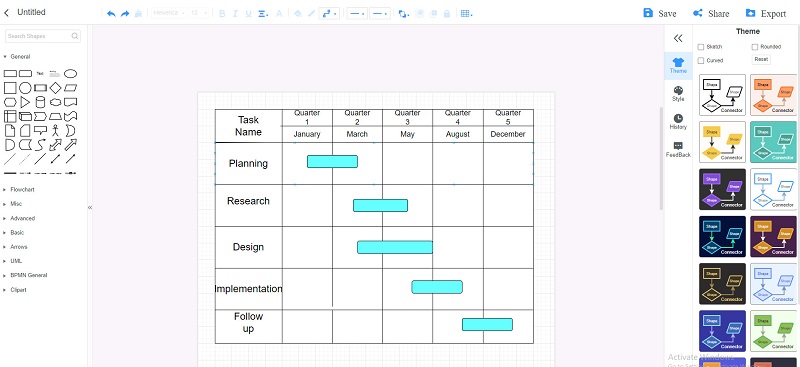
Then on the shapes, select the rectangle shape. Draw a table where you will make your Gantt Chart.
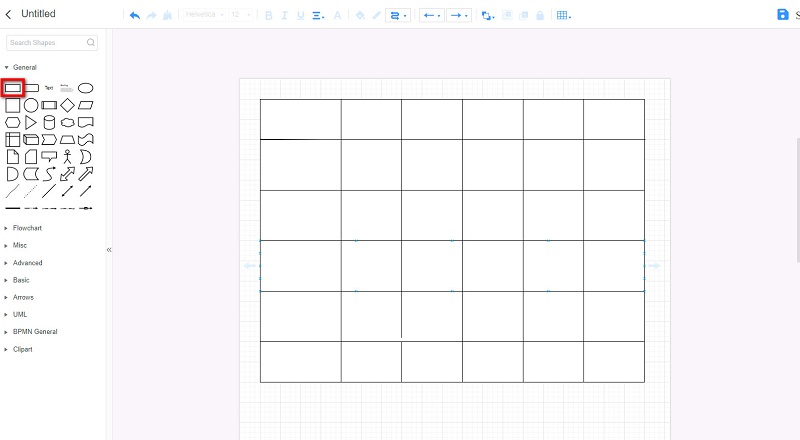
After creating your table, you can now add text to your Gantt Chart. You can also modify the color of your table by clicking the Fill color option.
You can now add your Milestones and modify the changes you need for your Gantt Chart.
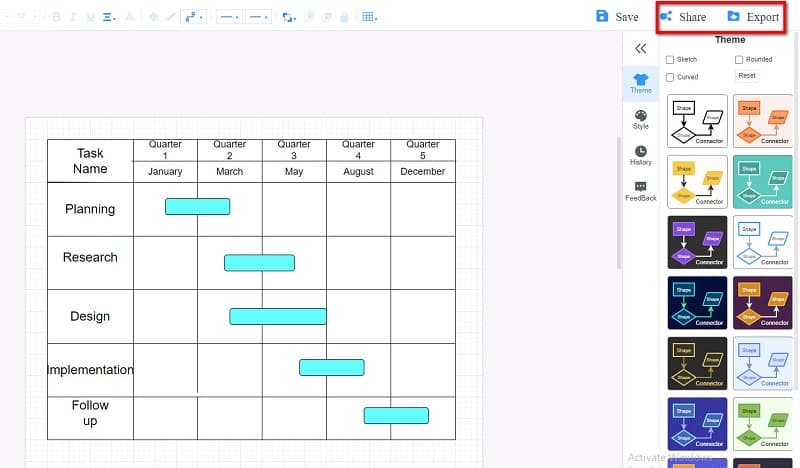
Once you are done, you can share the link with your team by clicking the Share button and then clicking copy link. But if you want to export your output, click the Export button and select the file format you prefer.
Part 5. FAQs about How to Make a Gantt Chart for Project Management
What type of projects are Gantt Charts best suited for?
Gantt Charts are best used for planning and scheduling projects because they allow you to see the interconnection of your activities.
Can I use Microsoft Excel to make a Gantt Chart?
Yes. You can use Excel to create a Gantt Chart. Go to Insert > Insert Bar Chart > Stacked Bar chart.
Which Microsoft application is the best for creating Gantt Charts?
Many professionals prefer using Microsoft Excel for creating Gantt Charts to other Microsoft applications because of the tool’s bar chart feature, which can convert their table into Gantt Chart.
Conclusion
Phew! That was quite a journey! Indeed, Gantt Charts are the best tools to use when creating a project management plan. It is easy to create a Gantt Chart as long as you have the software to use. So, if you want to create your Gantt Chart for project management magnificently, use MindOnMap now.