How to Create a Gantt Chart in Visio for Project Time Management
It is essential to plan everything precisely with many activities to carry out. That is especially true for project management. You will need an illustration to help you keep track of the project’s activities, from which activity to execute and which activity goes next, and which activity will be last executed.
This is where the Gantt chart comes in. It portrays a timeline-like graphical representation that illustrates all tasks carried out by the stakeholders done against time. Moreover, it keeps the team informed about necessary resources. One powerful tool that will help you make illustrations like the Gantt chart is Visio. With that being said, this post is intended to teach you how to use Microsoft Visio for Gantt chart making.

- Part 1. How to Create a Gantt Chart with the Best Alternative to Visio
- Part 2. How to Create a Gantt Chart in Visio
- Part 3. FAQs on Creating a Gantt Chart
Part 1. How to Create a Gantt Chart with the Best Alternative to Visio
Before diving into the Visio Gantt chart tutorial, let us first look at the great alternative tool. Many still find Visio challenging to navigate, and some cannot afford to purchase the program because it is pretty expensive. Nevertheless, we have an easy-to-use and accessible program recommendation for everyone. This tool is called MindOnMap.
It is a simple yet intelligent diagramming program that works online. This program helps you make diagrams and illustrations like Gantt charts for teams and individuals. Moreover, you can add icons to mark necessary events or activities. You can insert milestones, task indicators, summaries, etc. Furthermore, you can export projects to several formats, including JPG, PNG, SVG, Word, or PDF files.
Secure Download
Secure Download
Key Features of MindOnMap:
◆ Allows for exporting charts in various image and document formats.
◆ It provides different icons and attachments for your charts.
◆ It supports a handful of themes and layouts.
◆ Users can share projects for checking using the link.
◆ Compatible with all major or mainstream web browsers.
Find out how to make a Gantt Chart in Visio alternative by reading below.
Access MindOnMap website
Launch MindOnMapfrom using any web browser on your computer. When you land the page, click on the Create Your Mind Map button to enter the template section of the program.

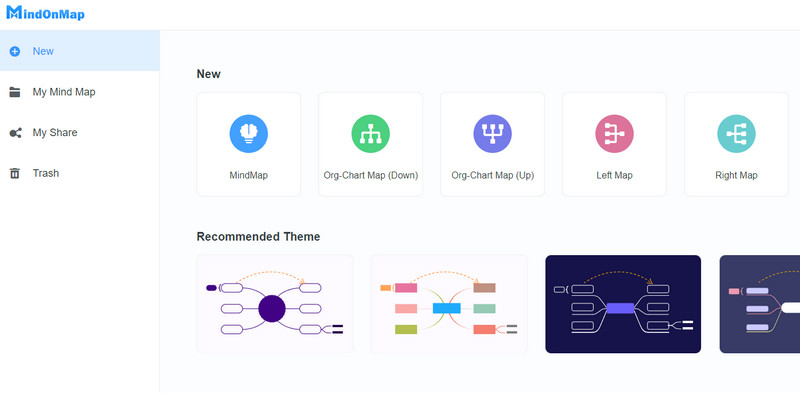
Select a template
From the template section, select a layout that best suits your Gantt chart to portray. Also, you can choose from the list of themes according to the style you wish for your Gantt chart.
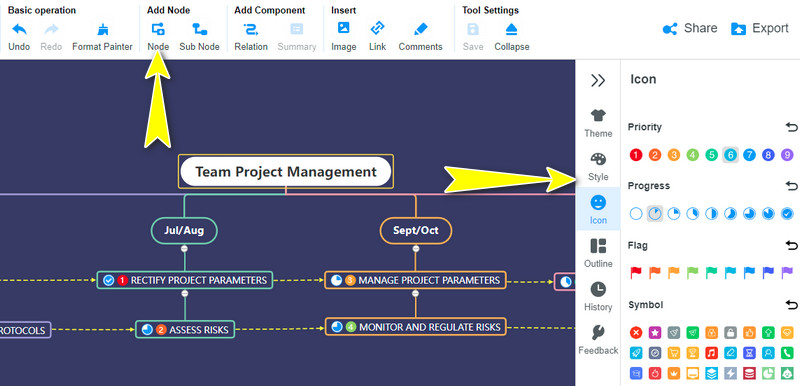
Edit your Gantt chart
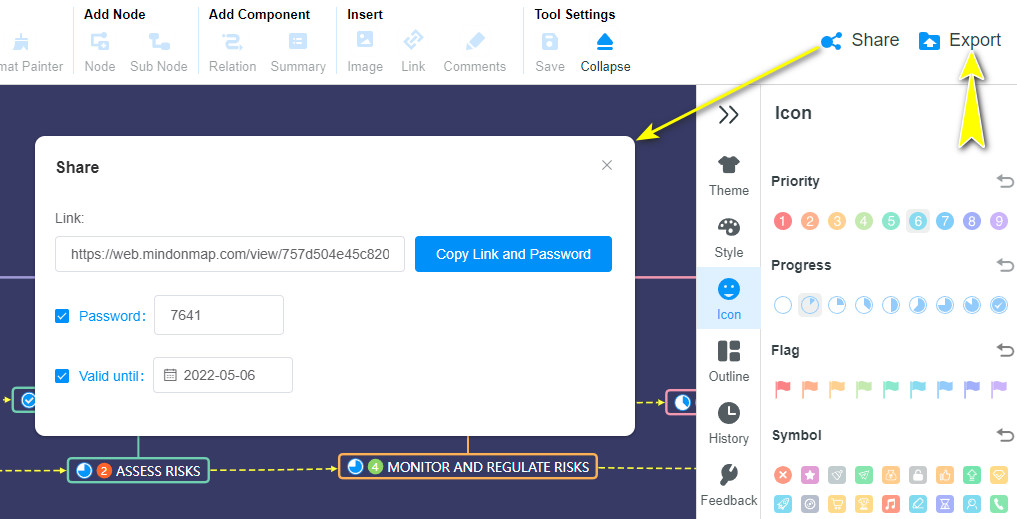
Add events using the nodes in the editing panel by clicking the Node button at the top menu and arranging them according to their order by adding dates as columns. Make sure to add them based on the row or activity they belong to. Then, you can add icons to indicate when the task is ongoing or completed. You may also style the nodes and the whole look of the illustration by going to the Style section on the right-side panel.
Export the finished Gantt chart
Before exporting the chart, you can allow other users to see your work. Tick the Share button at the top right corner, get the link and send it to your team. Then, you could discuss and amend the necessary revisions. Once finalized, click the Export button to produce a copy of your work.
Part 2. How to Create a Gantt Chart in Visio
Gantt chart is a scheduling task illustration for visualizing project management tasks. With Microsoft Visio, you can easily create a Gantt chart for project management. It comes with Gantt chart options to set preferences regarding the number of tasks and timescale range. Besides, the Gantt chart maker can change the date format, whether days, hours, weeks or even specify the hours per day. With no further explanations, here is how to draw a Gantt chart in Visio.
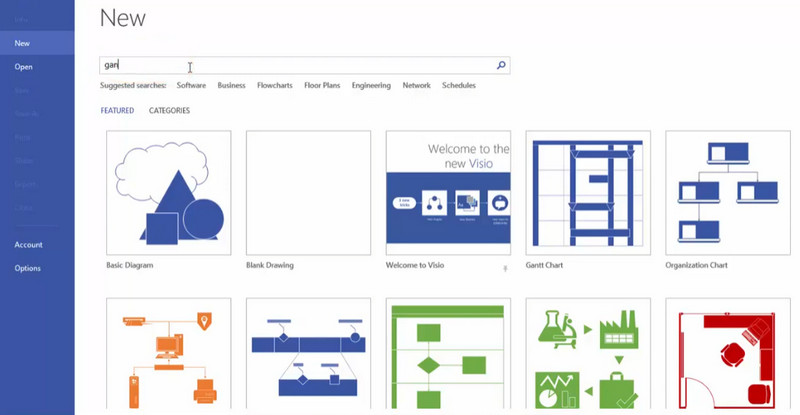
Set up the Microsoft Visio Gantt chart
Download and install Visio on your computer. Next, set up a Gantt chart by going to the New tab. Point to Schedule and choose Gantt Chart.
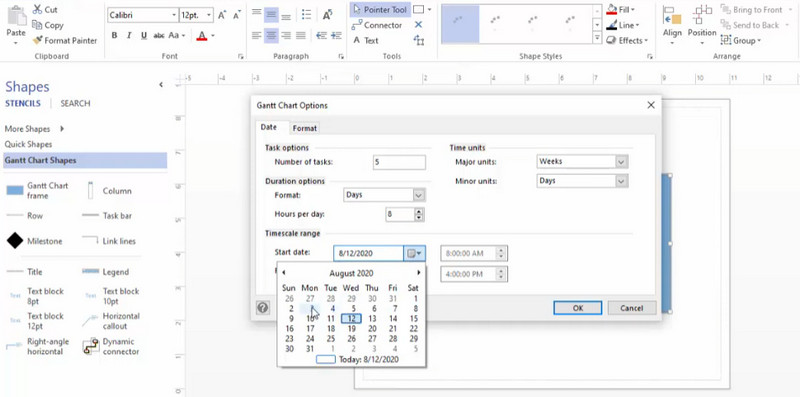
Edit Gantt chart options
After setting up, you will arrive at the editing panel. But before creating a Gantt chart, you will need to configure some Gantt chart options. Under the Date tab, you can modify the Task options, Duration options, and Timescale range. Hit OK to confirm the settings.
Edit format options
AIn the Format tab, you will set Task bars options, including Start shape, Finish shape, etc. Also, you can change the shape of the Milestones. Finally, alter the Summary bars as you please. Hit OK to confirm the settings. Then, it will produce the chart according to the modification you set.
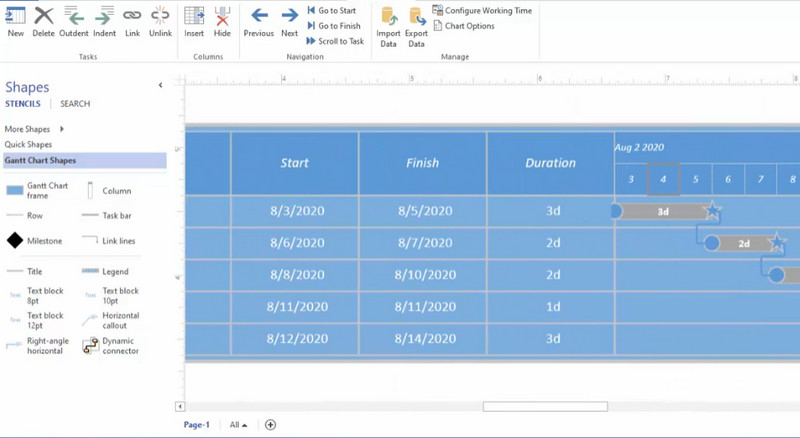
Edit and save the Gantt chart
Step 4. Edit and save the Gantt chartNow, edit the labels according to your project. Double click on each element and type the words you want to appear in the Gantt chart. Finally, go to File and hit Save to save your chart.
Further Reading
Part 3. FAQs on Creating a Gantt Chart in Visio
Is there an available Visio Gantt Chart template?
In fact, Visio does not offer templates. You can set a template of your own using the Gantt Chart options. You can set some options for tasks, dates, etc., to fit your requirements. Then, you can save it in Visio as your template.
Can I have the Visio Gantt chart template downloaded?
You may save your drawings or Visio Gantt chart templates by exporting them to SVG, EMF, JPG, or PNG. For the steps, go to the File option and select Export. From the Export menu, choose Change File Type. Then, select the type of image format you want to export the chart in the Save Drawing menu. Now, select save as and select a file destination.
Is Visio Gantt Chart import from Excel data possible?
Yes. Go to the Data tab and select Quick Import. Hit Browse and choose the workbook you prefer importing. Click the Open button followed by the Done button.
Conclusion
One of the crucial parts of a project is time management. Thankfully, you can use the Gantt chart to help you manage your time well, especially when completing a project. Therefore, we showed you how to create a Gantt Chart in Visio. As we all know, it is the most promising yet powerful diagramming tool. However, you may wish to make a Gantt chart easy. That being said, we introduced you to the best alternative, none other than MindOnMap. It outshines Visio in terms of convenience because you do not need to download a tool. It is like plug-and-play. Moreover, it features stylish designs you can incorporate into your charts. Yet, depending upon your needs, you should pick which app best suits your requirements.