4 Quick Steps to Conduct Fault Tree Analysis [FTA]
A Fault Tree Analysis, also known as FTA, is a reliable and powerful risk assessment tool ideal for identifying potential causes of system failure. By breaking down complicated failures into simpler and manageable events, the analysis can help safety analysts or engineers enhance the system and avoid critical errors. If you're interested in learning more about this type of discussion, we're here to guide you. In this post, we will discuss everything about Fault Tree Analysis, including its benefits, symbols, and how it works. After that, we will also introduce an exceptional tool that can help you create the visual representation. So, check this post and learn more about the topic.

- Part 1. What is a Fault Tree Analysis
- Part 2. Benefits of a Fault Tree Analysis
- Part 3. How Does Fault Tree Analysis Work
- Part 4. Common Symbols in a Fault Tree Analysis
- Part 5. How to Create a Fault Tree Analysis
- Part 6. FAQs about Fault Tree Analysis
Part 1. What is a Fault Tree Analysis
Fault Tree Analysis (FTA) diagrams are a well-structured method for identifying/determining potential failures in a system and understanding the underlying causes. Instead of guessing, they visually map out possible failure paths, starting with the primary problem (called the 'top event') and then drilling down into all the smaller issues that could lead to it. The advantage here is that the diagram displays various symbols, each with its own meaning, making the chart informative.
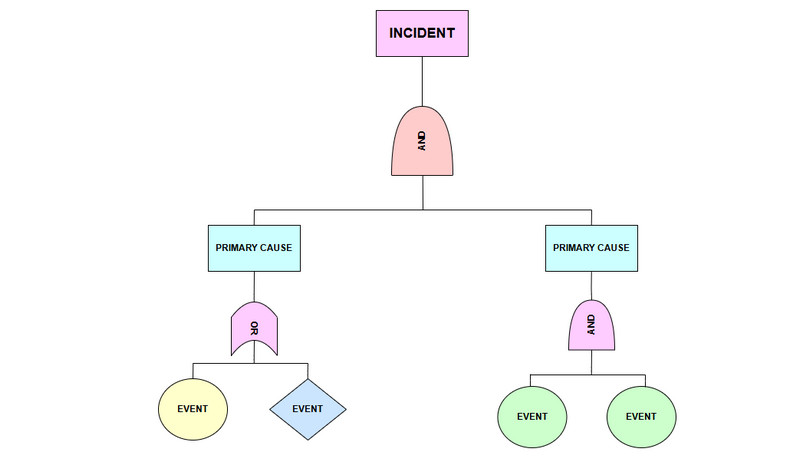
In addition to that, unlike methods like FMEA, which build up from individual component failures, Fault Tree Analysis works in reverse, starting with the worst-case scenario and tracing back the chain of causes. This makes it especially helpful and ideal for identifying complex failures where multiple things go wrong simultaneously, rather than just single-point breakdowns.
Part 2. Benefits of a Fault Tree Analysis
The Fault Tree Analysis diagram can also offer various benefits, making it a necessary tool for organizations or industries focused on reliability, safety, and efficiency. By identifying failures and their root causes, the group is empowered to address all issues before they occur. Review the information below to learn about its benefits.
Enhance Decision-Making
Using this diagram can help you visualize the failure pathways. With that, teams can better understand how various components and other events contribute to specific failures or problems. The positive aspect here is that it can provide better clarity, making it ideal for effective problem-solving and targeted interventions.
Enhance Risk Assessment
Another benefit of this diagram is that it can enhance risk assessment by ensuring that resources are allocated to the areas that require them. It can also provide a basis for informed decision-making, including upgrades to equipment, planning of maintenance, or creation of new systems
Better Communication
In a certain team, we all recognize that effective communication is crucial. It is one of the primary purposes of Fault Tree Analysis, as it can serve as an effective communication tool. Each team from a specific department can easily understand and collaborate on the diagram/analysis, helping them to complete tasks with the same objectives.
Stronger Compliance and Documentation
The Fault Tree Analysis diagram provides teams with a clear way to track failures, fixes, and system upgrades, all in one place. This not only simplifies audit preparation but also keeps everyone on the same page, making maintenance more transparent and accountable.
Part 3. How Does Fault Tree Analysis Work
Do you wonder how the FTA or Fault Tree Analysis works? It may be complicated if you are new to this field. With that, please review the information below to learn how it works.
Step 1. Define the Top Event
The first step in FTA is to clearly define the undesired event, known as the 'top event'. It represents a certain failure or unwanted outcome that you want to analyze. For example, if you are analyzing a failure on a seaplane, then the top event might be 'engine failure.' With that, having a clear identification of the top event can help you understand the causes of the specific failure.
Step 2. Understand the System
After determining the top event, the next step is to understand the system. This involves collecting detailed information about the system's design, operational procedures, historical failures, and components.
Step 3. Create the Fault Tree Diagram
Once you've defined the system and identified the main failure or top event, you can begin building your fault tree. First, map out the direct causes of the problem. These form the first branches of your diagram. Then, use logic gates such as AND/OR to illustrate how these events connect and interact.
Step 4. Analyze the Fault Tree
After you have constructed the diagram, the next step is to analyze it. Its main purpose is to assess the likelihood of the top event occurring. Then, two types of analysis can be conducted. These are quantitative and qualitative analyses.
Step 5. Mitigate Risks
Through fault tree analysis, you can begin identifying all the potential risks and take targeted steps to minimize them. It might involve redesigning critical components, enhancing maintenance routines, or updating safety procedures. Additionally, you can set up early warning systems to determine potential issues/problems before they escalate, thereby helping to prevent major failures from occurring.
Part 4. Common Symbols in a Fault Tree Analysis
In the diagram, there are various symbols you can see. Little did you know, each symbol has meaning. With that, to get more insights about the symbol under the Fault Tree Analysis, check all the details below.
Event Symbols
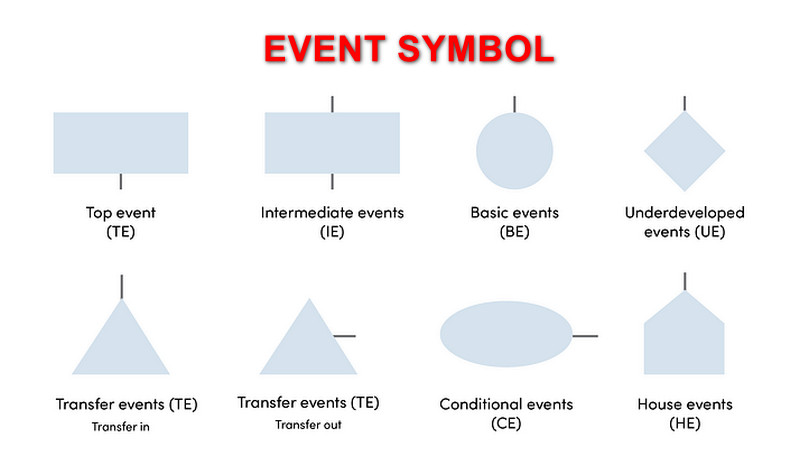
There are different Event symbols under the FTA, such as:
Top Event (TE) - The main system failure we're investigating. It's the starting point of our analysis (no outputs, only the initiating failure). You will see this symbol at the top of the diagram.
Intermediate Events (IE) - The chain reactions in our failure scenario. These have both causes (inputs) and consequences (outputs), linking basic causes to the top failure.
Basic Events (BE) - This symbol identifies the root causes at the bottom of the tree. These are the fundamental failures that start the chain reaction upward.
Underdeveloped Events (UE) - 'To be determined' placeholders when additional data is required. These get their mini-trees (subtrees) for future analysis.
Transfer Events (TE) - The 'see other page' markers for complex trees. They come in two flavors:
Transfer-out - points to a continuation elsewhere
Transfer-in - shows where another branch connects
Conditional Events (CE) - Special circumstances that only matter for inhibit gates (think 'only fails if X happens during Y condition').
House Events (HE) - The on/off switches for your analysis:
0 = ignore this branch
1 = include this branch
Gate Symbols
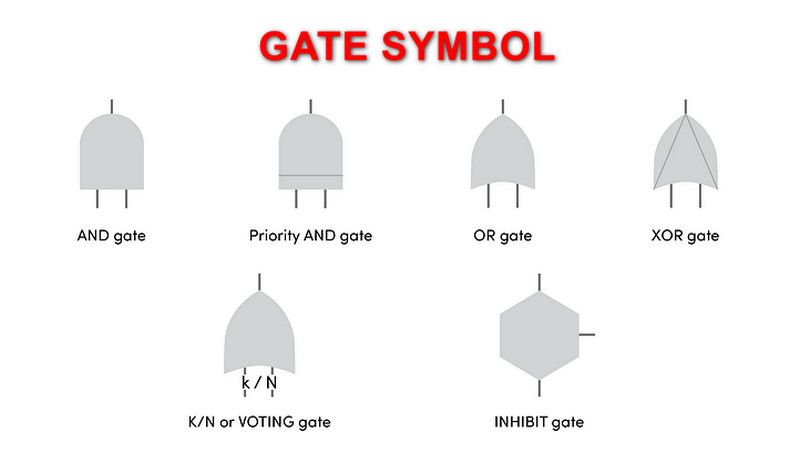
There are also gate symbols you can use on your diagram. These are:
AND gate - This symbol is connected to the output events. It only occurs when input events reach the gate.
Priority AND gate - This symbol indicates that all events must occur in a specific order.
OR gate - This type of gate can have one or two inputs.
XOR gate - This symbol can only appear if the input elements occur.
Voting gate - This symbol is similar to an OR Gate. To trigger the gate, a specific number of inputs is required.
INHIBIT gate - This symbol will have an output event when all the conditional and input events occur.
Part 5. How to Create a Fault Tree Analysis
Do you want to create an engaging Fault Tree Analysis? In that case, the best diagram creator you can use is MindOnMap. This tool is perfect since it can offer all the features you need. You can even attach all the symbols you need, such as the top event, basic event, transfer event, and all of the gate symbols. Moreover, you can navigate everything smoothly, thanks to the tool's simple and neat user interface. Additionally, you can rely on its auto-saving feature to prevent data loss during the creation process. Another benefit is that you can save the Fault Tree Analysis on your desktop and MindOnMap account, allowing you to preserve the diagram in various ways. To create the best Fault Tree Analysis, follow the procedure below using this Fault Tree Analysis software.
Click Download below to start installing MindOnMap on your desktop. After that, open it to begin the creation process.
Secure Download
Secure Download
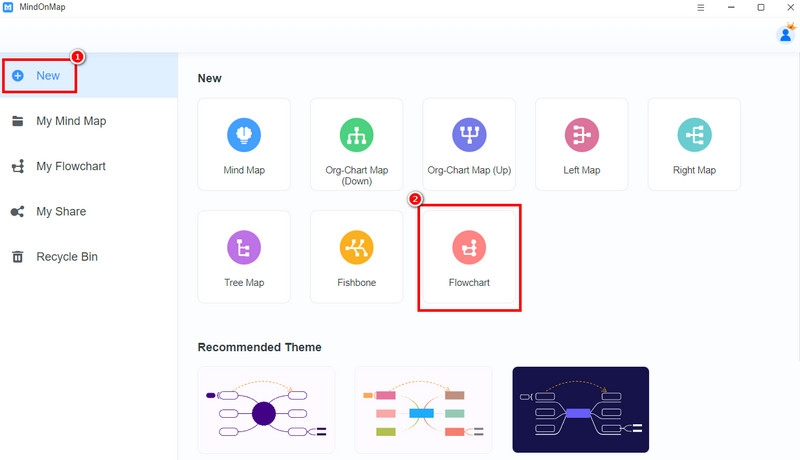
For the next process, go to the New section. Then, tap the Flowchart feature to view its main user interface.
You can start making the Fault Tree Analysis. Navigate to the General section and use all the Event and Gate symbols you need. Double-click the symbol/shape to insert the text.
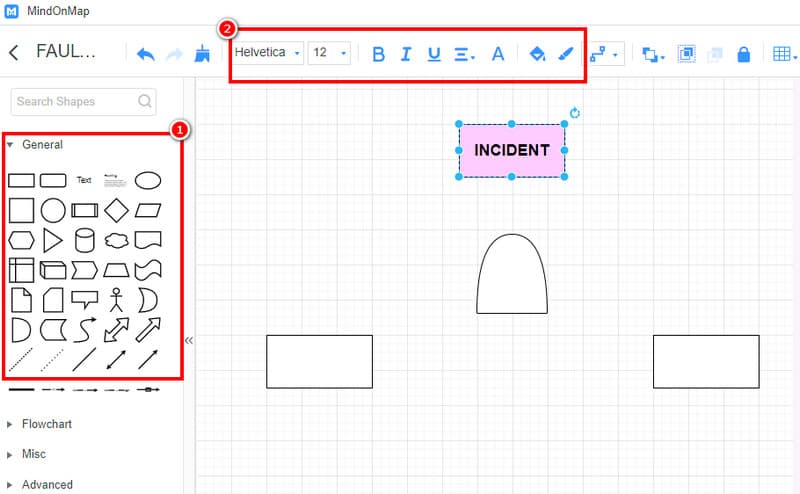
To add color, you can use the Fill color function. You can also use all the functions above.
For the last touch, tap Save to keep the Fault Tree Analysis on your MindOnMap account. You can also save it in various formats using the Export feature.
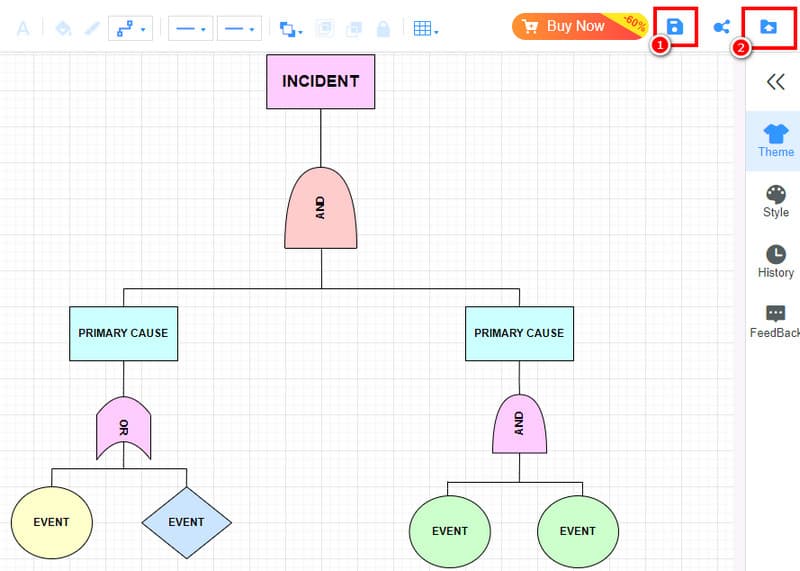
Tap here to view the complete Fault Tree Analysis made by MindOnMap.
Thanks to this process, you can create a Fault Tree Analysis perfectly. You can even access all the necessary symbols, making it an excellent diagram maker. Thus, rely on and download this Fault Tree Analysis software for free to create an engaging visual representation.
Check here: Various Fault Tree Analysis Examples and Templates.
Part 6. FAQs about Fault Tree Analysis
What are the main uses of the Fault Tree Analysis?
Its main objective is to analyze failures for complex assets and systems. This diagram can help identify the cause of a failure, which can help you prevent them in the future.
Is it hard to create a Fault Tree Analysis?
It depends on the tool you use. If you are a non-professional user, you can use a simple diagram creator that offers all the features you need, such as MindOnMap. With this tool, you can achieve the result you need.
Who invented the Fault Tree Analysis?
The inventor of Fault Tree Analysis is H.A. Watson of the Bell Telephone Laboratories. He invented this diagram in 1961.
Conclusion
Now, you have learned how to create the best Fault Tree Analysis. You also gain more insight into its benefits, how it works, and all the symbols. In addition to that, if you need the best diagram creator to create an appealing Fault Tree Analysis, you can access MindOnMap. This tool provides all the gates and event symbols you need to create an impressive diagram.