How to Perform Gap Analysis Using the Simple & Professional Ways
A gap analysis is the process of identifying the difference between the current state to its future expectations. The main objective of it is to bridge the gaps in the business or companies. By determining these gaps, they can create strategies to enhance operations and performance. It may sound complicated, but it can be done in a few simple steps. In this guidepost, learn how to do a gap analysis in Excel as well. Aside from that, get to know another best way to make one.

- Part 1. How to Perform a Gap Analysis
- Part 2. How to Create a Gap Analysis Chart in Excel
- Part 3. How to Create a Gap Analysis Chart in MindOnMap
- Part 4. FAQs About How to Conduct Gap Analysis
Part 1. How to Perform a Gap Analysis
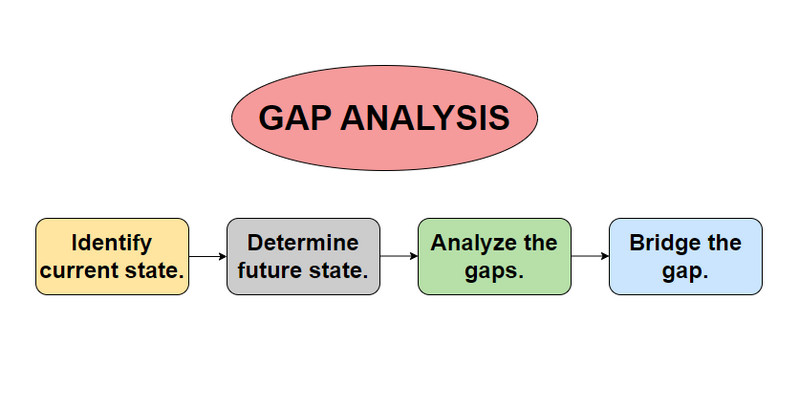
In the process of performing a gap analysis, there are only 4 easy steps you need to take. But also note that each company has a specific focus in a gap analysis. In actuality, you can do a gap analysis according to your needs and preferences.
Step 1. Identify the current situation.
First, define what is important in your business or organization. Then, you have to know where you are at the current time. This approach prevents scope expansion and ensures the focus of your analysis. Afterward, you need to gather data, the important ones to be specific. It may be a lot to collect, but hang on. The more you collect, the clearer picture of your current status you’ll see.
Step 2. Determine the desired state.
The ultimate goal of the gap analysis is to identify your destination and evaluate your process toward it. This destination represents your future objectives, expected state, and goals. If everything worked according to plan, what state would you be in? So, make sure you have decided on it already.
Step 3. Analyze the gaps.
By now, you know your current state and your desired and expected state. The gap between these two is what you must bridge to achieve your goals. Evaluate these gaps and determine the root of the problem. In this step, you have to be very specific. You can also ask yourself some questions related to your business and answer them in an honest way.
Step 4. Bridge the gap.
After accomplishing the three steps, it’s time to develop action plans. You have to bridge the gap you have identified using strategies. These strategies may include actions, allocating resources, and making plans to achieve your goals. The key is to take concrete steps to close the gaps and move toward your desired state. Implementation is critical; otherwise, the analysis remains theoretical. Last but not least, ensure to have deadlines to avoid things being overlooked and disregarded.
Part 2. How to Create a Gap Analysis Chart in Excel
Microsoft Excel is a spreadsheet tool that lets you organize, analyze, and visualize data in an effective way. It is also a popular tool for creating various charts and graphs. These include gap analysis charts, which are essential for businesses to identify discrepancies between desired and actual outcomes. In this tutorial, we'll walk you through the steps to create a gap analysis chart in Excel.
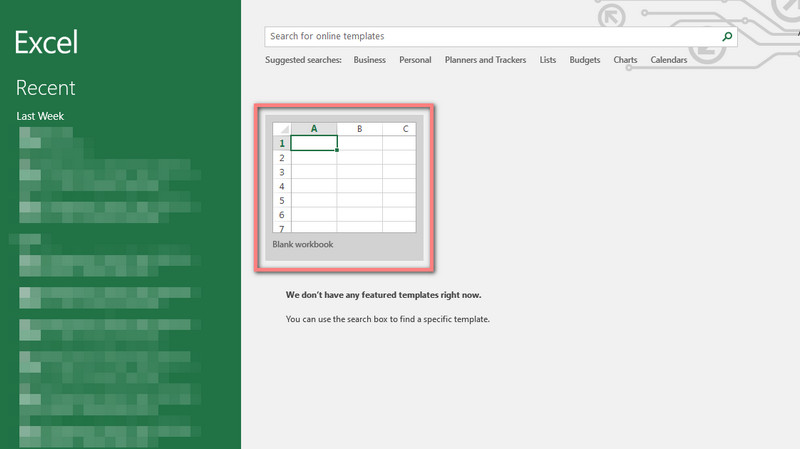
Firstly, launch Microsoft Excel and open a new worksheet. You'll be using this worksheet to build your gap analysis chart.
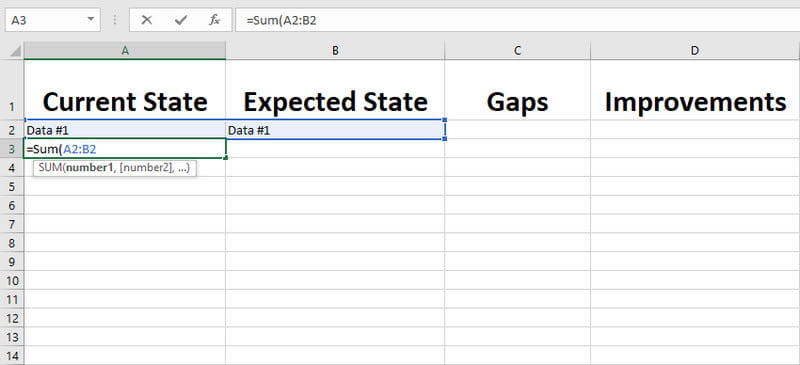
Input your data into the worksheet. Typically, you would have columns for your criteria. It includes the current state and the desired state. Ensure that each set of data is in its own column for clarity.
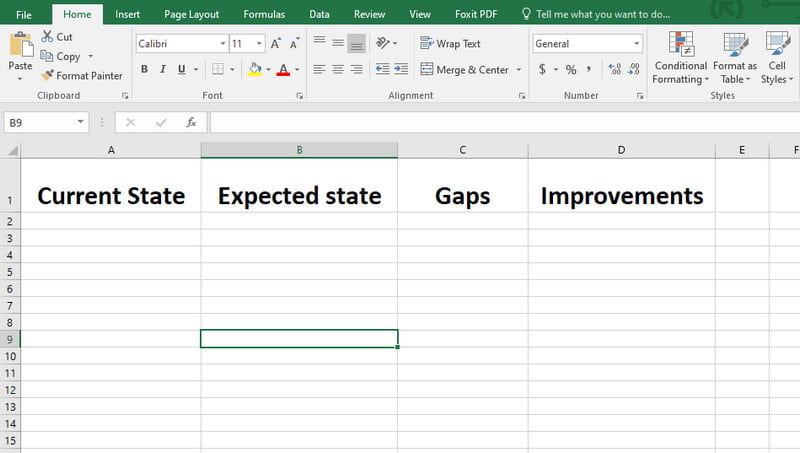
Now, you’ll learn how to calculate gap analysis for each criterion. You can do this by subtracting the current state value from the desired state value. Excel's formula capabilities make this calculation quick.
Next, choose the calculated gap values and the criteria column. Then, go to the Insert tab and choose a suitable bar chart or column chart type. A clustered bar chart works well for gap analysis.
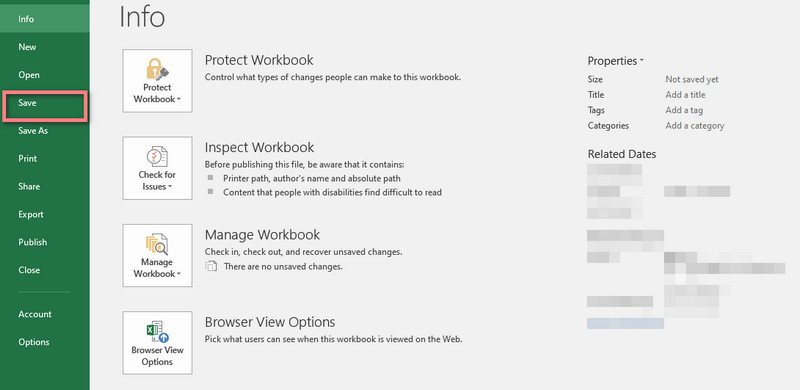
Customize your chart to make it more informative. Add data labels, titles, and axis labels. Finally, click the File tab and choose Save from the menu to save your work on your computer.
Part 3. How to Create a Gap Analysis Chart in MindOnMap
To create a comprehensive gap analysis chart, MindOnMap is your ultimate solution. It is an internet-based diagram maker that lets you make any visual presentations with ease. You can access the platform on various browsers, like Safari, Edge, Google Chrome, and so on. Its downloadable application is also available for operating systems such as Mac and Windows. MindOnMap provides many chart-editing features and functions. With it, you can personalize your diagram by adding shapes, textboxes, lines, color fills, and more. You can also insert photos and links as you wish. Not only that, it offers several template options you can choose from. Using it, you can also make fishbone diagrams, organizational charts, treemaps, and many more.
What’s more, its standout qualities lie in its collaborative capabilities, allowing real-time teamwork. Another thing, it supports the auto-saving feature. It means after you stop working on the tool, all the changes you made will remain as it is. If you’re excited to know how you can do a gap analysis with it, follow the steps below. Also, check out an example of a gap analysis diagram.
Access online or download the app
To begin, visit the official website of MindOnMap to access its main page. From there, you can choose between Free Download or Create Online. Click the button you prefer to continue.
Secure Download
Secure Download
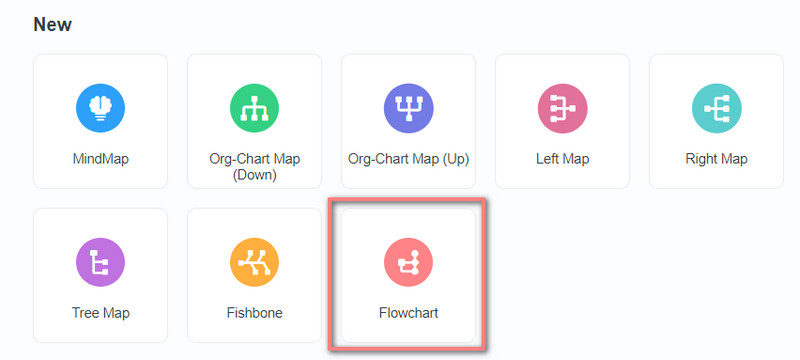
Select flowchart layout
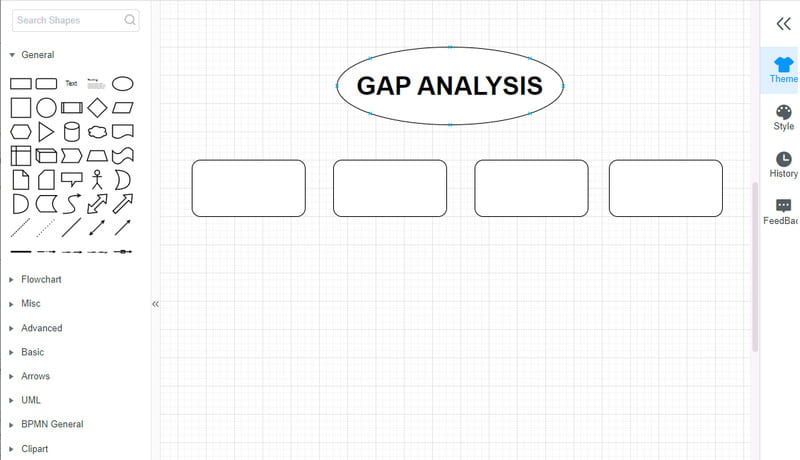
In the tool’s main interface, you’ll find various templates. Select the Flowchart layout. In this tutorial, we’ll use the flowchart template to create a gap analysis diagram.
Customize gap analysis chart
Now, start personalizing your gap analysis chart. Select shapes, lines, text boxes, and everything you need for your diagram.
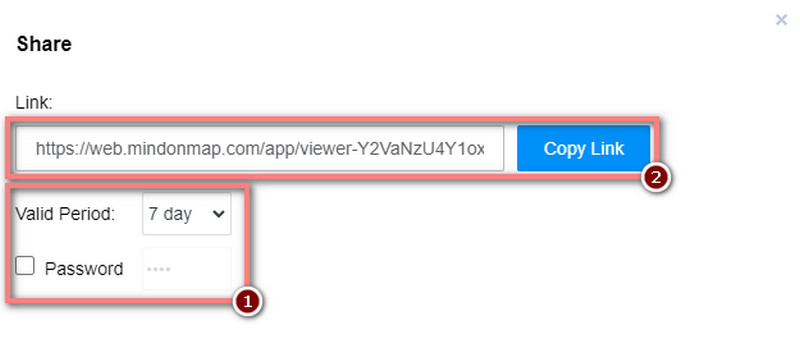
Share the chart
To work with your teams or colleagues, use the collaborative feature of the tool. To do it, click the Share button. After that, set the Valid Period and Password to enhance security. Then, hit the Copy Link button and share it.
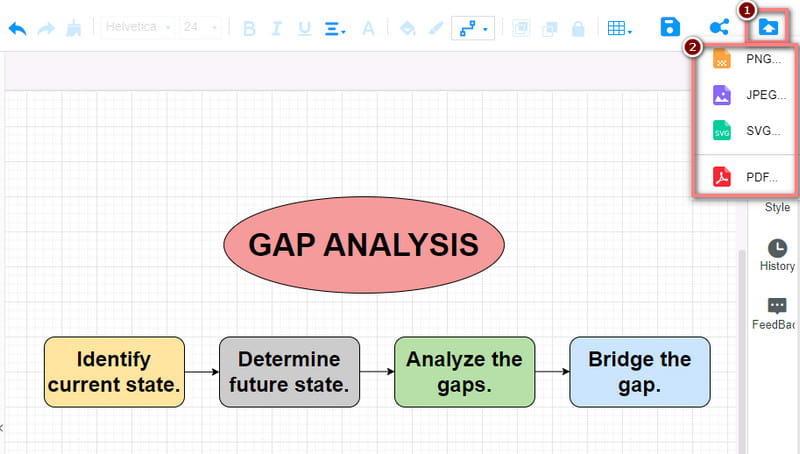
Export the chart
Once done, you may now save your work. Do it by clicking the Export button at the top-right corner. Finally, choose your desired file format and wait until the process is done. And there you have it!
Further Reading
Part 4. FAQs About How to Conduct Gap Analysis
What questions are asked in a gap analysis?
Questions in a gap analysis include the current state, desired future state and identifying the reasons for the gap. Examples are: “What are our goals?” “What is our current performance?” “Why is there a gap between the two?”
How to do a strategic gap analysis?
To perform a strategic gap analysis, you can follow the steps mentioned above. It includes assessing your current state, defining goals, and identifying gaps. Finally, create strategies to bridge those gaps and implement those strategies.
How to do a Gap analysis in healthcare?
To conduct a gap analysis in healthcare, gather data on current healthcare practices. Then, compare them to industry standards or desired outcomes. Next, identify gaps in performance. Lastly, implement strategies to improve healthcare processes and patient care.
Conclusion
To conclude, you have learned how to do a gap analysis. It is also considered a crucial step in the path to organizational growth and improvement. Besides that, you’ve got to know the best two software that allows you to create your desired chart. Yet, when it comes to a customizable diagram, MindOnMap stands out. A straightforward chart maker that suits professionals and beginners.