Visual Map: Description, Types, and Method to Make One
In this world where information always overflows, clarity often comes from how ideas and data are organized and presented. A visual map is a powerful tool that can turn a complex concept into a well-structured, comprehensive visual representation. By merging keywords, images, and connections, a visual map allows teams or individuals to view relationships, hierarchies, and patterns at a glance. So, are you interested in learning about a visual map? Then read this post. We will offer all the information, including its different types. We will also provide you with the best tutorial to create an astounding visual representation. Without anything else, see this article and explore more.

- Part 1. What is a Visual Map
- Part 2. Different Types of a Visual Map
- Part 3. Best Tools to Create a Visual Map
- Part 4. FAQs about Visual Map
Part 1. What is a Visual Map
A visual map is a chart that arranges data so that relationships and structures are easy to see. Instead of showcasing ideas in a linear format like traditional notes, a visual map uses shapes, lines, colors, and sometimes images to show how concepts connect. This approach helps people grasp complex topics quickly, as the mind processes visuals faster than text. It can even help a person enhance creativity and critical thinking. thinking. Common forms of visual maps include mind maps, concept maps, and flowcharts, each designed to clearly and engagingly highlight connections, hierarchies, or processes.
Part 2. Different Types of a Visual Map
Want to learn various visual maps?? In that case, you must read this section, as we provide some of the most commonly used visual maps for showing various subjects and connections.
Tree Map
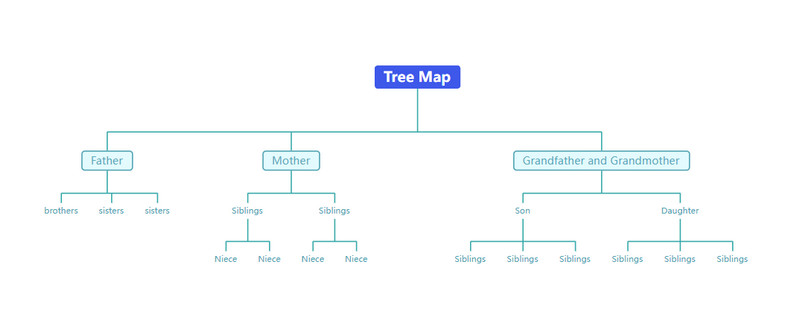
One common visual map you can use is the Tree Map. As the anime suggests, it is a visual map that follows a hierarchical, tree-like structure. It begins with a central node representing the main topic or subject. It also has branches that expand into more specific ideas and subtopics. One of the best topics to include in a tree map is a family tree. With this map, you can insert all family members from top to bottom. You can even arrange them hierarchically. You can also use the map to showcase company members, a team from a specific group, and more.
Flow Map
A Flow Map is, in essence, a flowchart that depicts the order of steps or levels. This kind of mind map illustrates the sequence or flow of ideas, actions, or time. In general, a flow map starts with an initiating point and is constructed in stages, terminating at a point or state. Flow Mind Map types are ideal for processes or procedures, or for events that occur in a logical order. They offer a linear path of understanding and are especially helpful for breaking complex concepts into how one thing leads to another, as well as for visually representing complex ideas in an aesthetically pleasing way.
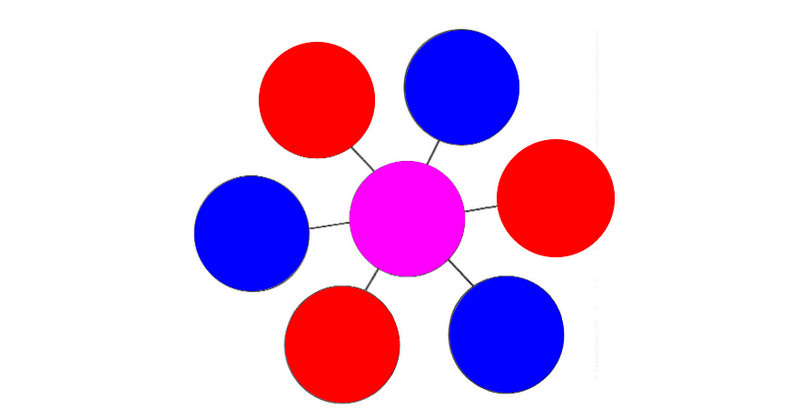
Circle Map
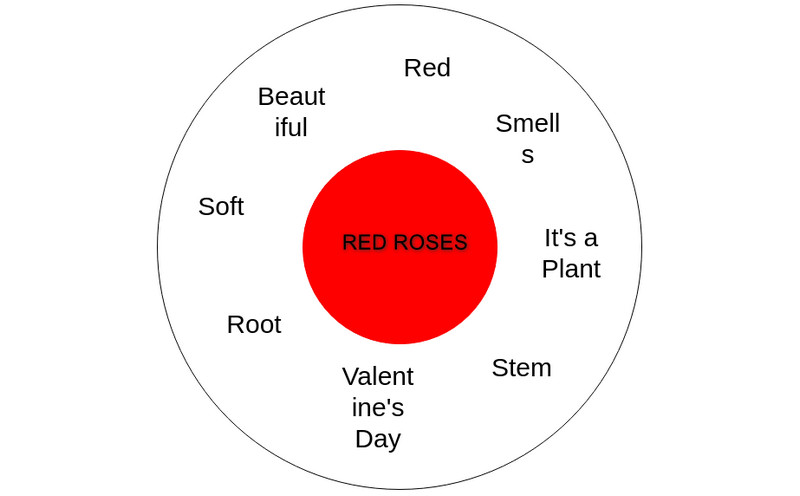
The Circle Map is one of the eight thinking maps developed by Dr. David Hyerle. It provides a visual structure to aid in conceptualizing and organizing ideas. The circle map focuses on situating an idea in its surroundings: the center of the circle houses a core concept or main topic, and the outer ring is filled with words, phrases, and other examples that explain it. This design also provides an efficient way to define meaning, evoke associations, and foster understanding by visually illustrating connections from a central topic.
Spider Map
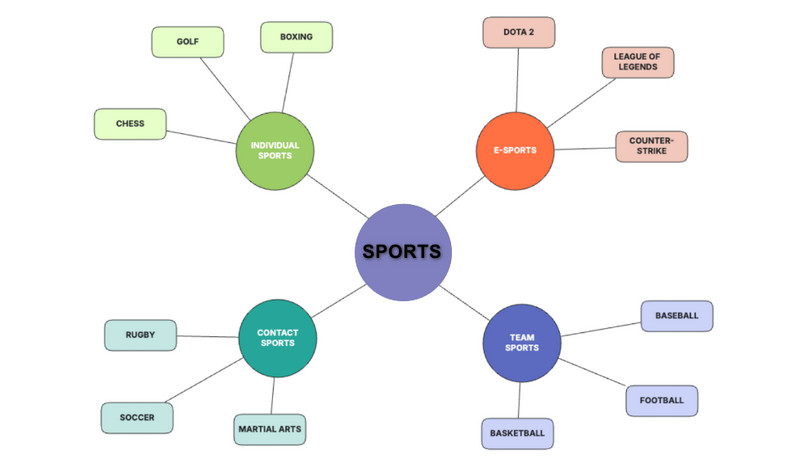
A Spider Map is a common type of visual map known by its branching, outward design. It starts with a central theme or idea placed at the core, from which subtopics extend outward like the legs. After viewing its structure, you can really see its spider-like chart. Each branch can further divide into smaller sections that capture related information or support concepts. In addition, spider maps are particularly useful for examining a main topic in depth, breaking it into components, and arranging connected ideas. They work effectively for defining subjects, generating ideas, and visually exploring different dimensions of a concept.
Part 3. Best Tools to Create a Visual Map
After knowing what a visual map is and its types, maybe you may wonder how to create one. In that case, for an effective visual mapping, we recommend using MindOnMap for effective visual mapping. With this tool, you can ensure that you craft the best visual map. It is because it can provide all the features you need. You can access various shapes, connecting lines, images, stickers, font styles, and more. The best part is that visual mapping is simple thanks to its intuitive user interface. It can also provide you with a range of ready-to-use templates and themes, resulting in better output. What makes the tool powerful is its capability to support AI-powered technology. With this feature, you can generate the best map in just a second. Lastly, you can save your final visual map in various formats, such as JPG, SVG, PDF, PNG, DOCX, and more.
To start visual mapping, use the steps below.
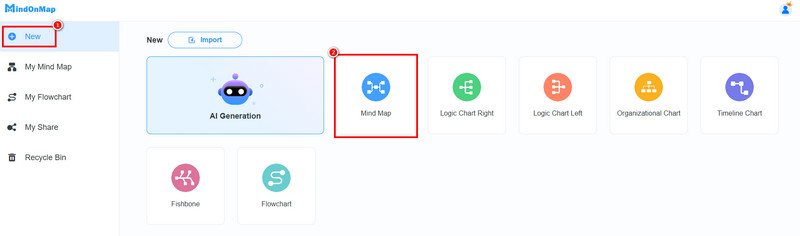
Download MindOnMap on your computer. Then, create your account to start the visual mapping process.
From the primary user interface, proceed to the New section. Then, click the Mind Map feature to show the tool's main interface.
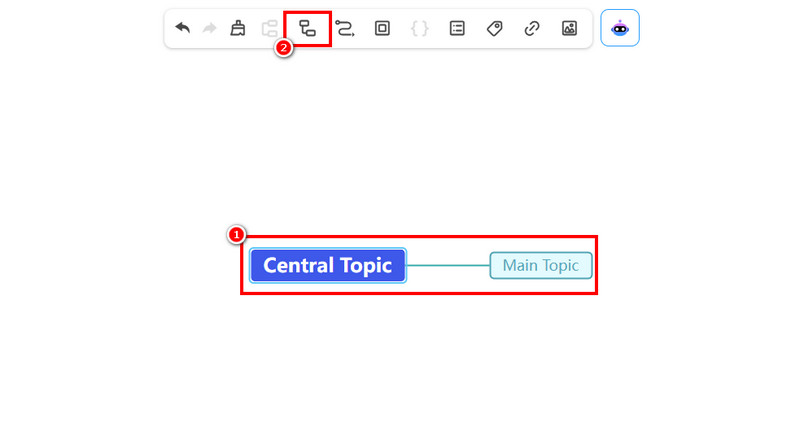
You can now begin making your visual map. You can tick the Blue box in the middle interface to insert your main topic. To add a branch or nodes, click the Subnode function above.
Once you are done creating your visual map, you can save it. Click the Save function above to save the visual map to your account.
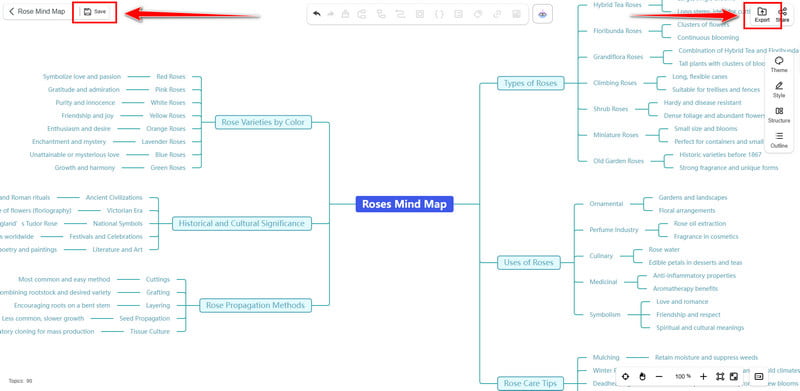
To save it on your device, tap the Export button and choose your preferred format.
Click here to check the complete visual map designed by MindOnMap.
With this method, you can tell that making a visual map is simple. The tool can even offer all the best features you can rely on to achieve your preferred output. The best part is that you can create various maps with this map maker. You can generate a multi-flow map, a biology map, a tree map, and more.
Part 4. FAQs about Visual Map
Is creating a visual map easy?
Definitely, yes. Creating a visual map is easy with an excellent map maker. To smoothly craft the best visual map without any difficulties, you can use MindOnMap.
Who can benefit when using a visual map?
Students, professionals, educators, and creatives all benefit from visual maps. They are versatile tools for strategizing, learning, teaching, and presenting ideas in both academic and workplace settings.
What are the common types of visual maps?
There are various types of visual maps. Some of them are concept maps, spider maps, circle maps, flowcharts, and more. These maps are perfect for organizing your ideas in a well-structured output.
Conclusion
Visual Maps are ideal if you want to transform your text and ideas into well-structured, organized charts. The best part is that you can add as many ideas and subtopics as needed to support your main ideas. Thanks to this article, you have learned about a visual map and its types. You also learned how to create the best visual map using MindOnMap. Thus, always rely on this tool to craft the best visual representation.