What is Cause and Effect Diagram: Definition with Simple Methods to Create
A cause and effect diagram is an effective visualization tool to see the possible result of a particular problem. This type of diagram can help you understand more about a certain issue you want to analyze. In that case, if you want to discover more about the cause and effect diagram, grab the opportunity to read the post. We will provide all the details you need about the discussion. In addition, you will discover how to construct a cause and effect diagram using online and offline software. Don’t miss the chance and start reading the article.

- Part 1. Complete Details about Cause and Effect Diagram
- Part 2. What Cause and Effect Diagram is Used For
- Part 3. Ways to Create A Cause and Effect Diagram
- Part 4. Pros and Cons of Cause and Effect Diagram
- Part 5. FAQs about Cause and Effect Diagram
Part 1. Complete Details about Cause and Effect Diagram
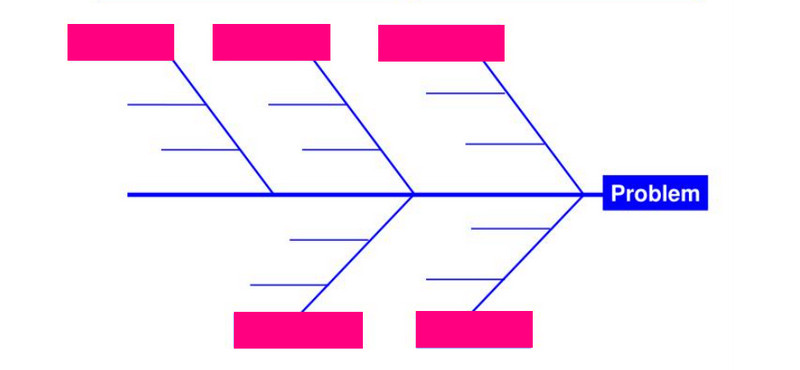
A cause and effect diagram breaks down probable reasons into more manageable divisions. It is to examine why something occurred or could occur. The relationships between the relevant components can be demonstrated using it as well. The cause and effect fishbone diagram is another name for this kind of illustration. It's because the finished diagram resembles the skeleton of a fish. The diagram has a fish head to the right of it. The bones then split off to the left, behind it.
Part 2. What Cause and Effect Diagram is Used For
There are lots of reasons why you need to create a cause-and-effect diagram. There are three key areas where you can use a cause and effects fishbone diagram.
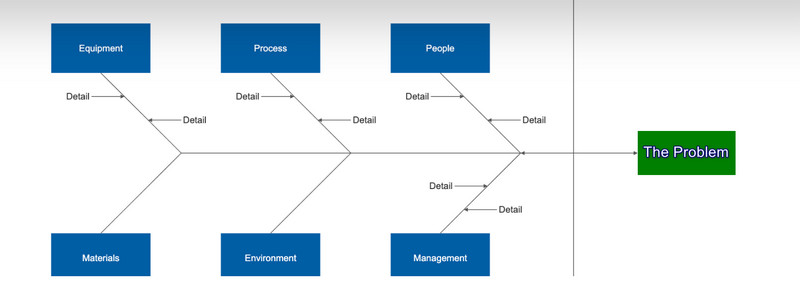
Manufacturing a product
This involves analyzing the 6M’s factor in production processes. See the 6M’s below for guides and better understanding.
Machines - It talks about some issues with the tools.
Materials - It concerns the quality of supplies and the suppliers' materials.
Machines - It talks about some issues with the tools.
Measurements - These deal with contamination and calculation that may cause false readings.
Mother Nature - It is about the temperature, if hot or cold. It concerns the environment.
Manpower - Analyzing if the people have enough training. Also, if the people already have experience or none.
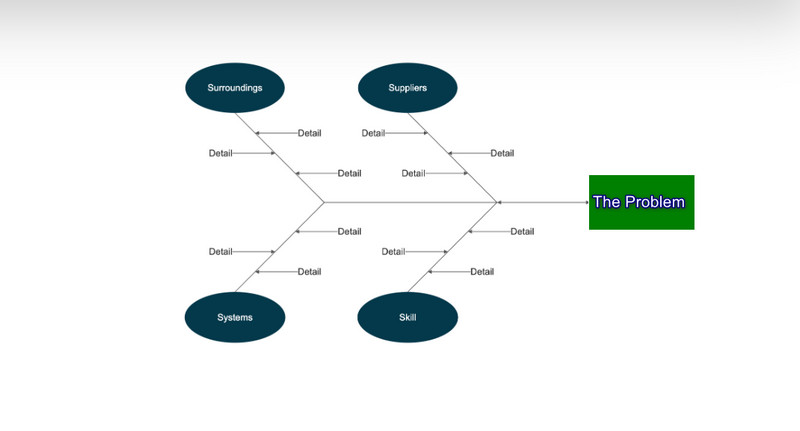
Providing a service
For providing a service, it includes 4S’s. You can follow these guide questions for your diagram.
Surrounding - Does your business present the best image? Is it comfortable?
Supplier - Do you have any problems providing your service? Do you frequently receive deliveries of subpar food? Are there too many missed calls on the phone?
System - Do all possible scenarios have policies and procedures in place? Do you have up-to-date cash registers that facilitate efficient order placement and check delivery by your servers?
Skill - Are your staff members sufficiently educated? Do they possess the necessary expertise?
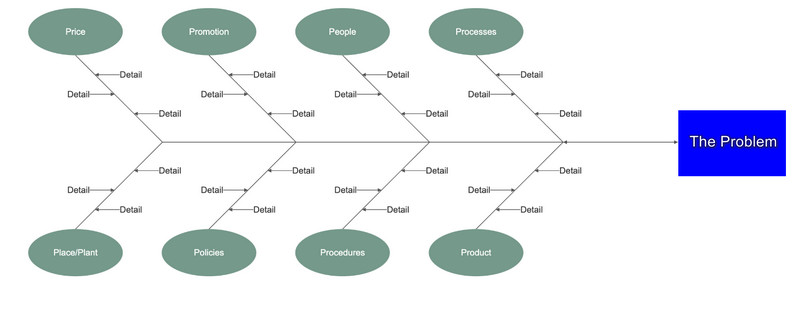
Marketing a product or service
In the industry of marketing, It consists of 7P factors.
Product - Consider all facets of your product, such as its quality, perceived image, availability, warranties, support, and customer service.
People - Customers who purchase your goods or services might deal with various people. It also includes salespeople, customer care representatives, couriers, and more.
Process - It is about handling obstacles when they arise.
Promotion - Consider partnerships, social media, direct marketing, PR, branding, and advertising.
Price - How does your good or service cost compare to your rivals? What payment options and discounts are offered?
Physical Evidence - It is about how you consume a service or product. Also, it includes the neatness of a facility.
Place - It talks about the convenience of the store to the customer targets.
Part 3. Ways to Create A Cause and Effect Diagram
How to Make A Cause and Effect Diagram on MindOnMap
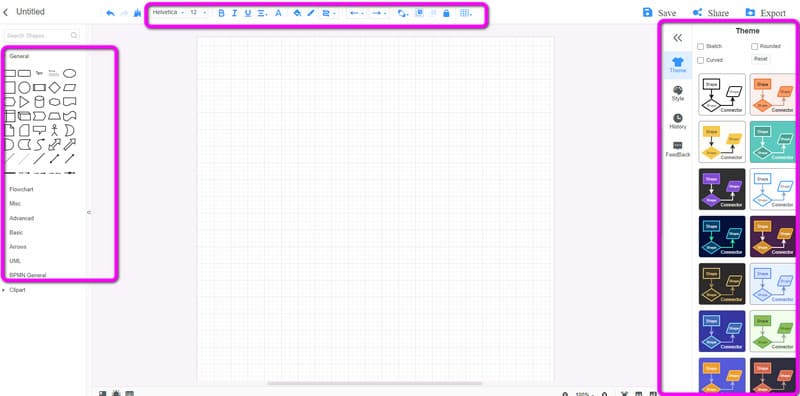
We can offer you the best tool if you plan to create a cause-and-effect diagram online. One of the diagram creators you can use online is MindOnMap. This web-based maker is simple to use. You can access this online tool on all website platforms. It also has a basic interface, which is perfect for all users. In addition, MindOnMap can offer all the shapes you need for your diagram. You can even put a color to produce an attractive cause and effect fishbone diagram. Additionally, you can use free themes to give additional flavor to your diagram. This way, viewers can see it as more beautiful and engaging.
Aside from that, you can insert text and change font styles. Another feature you can experience in this online tool is its ability to save the output automatically. MindOnMap offers an auto-saving feature. This feature won’t let you delete your diagrams easily and instantly. Also, it has a smooth exporting feature. You can export your final diagram into various output formats quickly. You can save the diagram to PDF, PNG, JPG, DOC, SVG, and more. Moreover, you can save the diagram on your MindOnMap account for further preservation. Follow the basic procedure below to learn how to do a cause and effect diagram using MindOnMap.
Secure Download
Secure Download
For this step, go to the official website of MindOnMap. Create your MindOnMap account to operate the tool. You can also use your Gmail account to connect it on MindOnMap. Then, click the Create Your Mind Map option on the center part of the interface.

Then, another web page will pop up on the screen. Select the New menu on the left part of the web page. After that, click the Flowchart icon. Afterward, the MindOnMap’s main interface will show up on the screen.
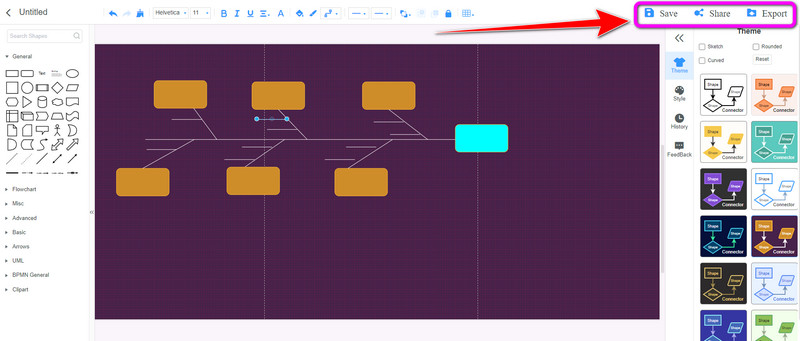
In this section, you can begin creating a cause-and-effect diagram. Go to the left interface to use various shapes for the diagram. You can also insert text, use advanced shapes, and more. On the upper interface, you can use the tools to insert color on the shapes, change font styles and sizes, and more. If you want to use various themes, you can go to the right interface and select the Theme option.
Click the Save button to save your final cause-and-effect fishbone diagram on your MindOnMap account. To share your work with others, select the Share option. Lastly, to save the diagram to other output formats, click the Export option.
How to Draw Cause and Effect Diagram in Word
Use Microsoft Word if you are looking for an offline way to create a cause and effect diagram. This program lets you make a cause-and-effect fishbone diagram quickly and easily. It can provide any component you require throughout the procedure. Microsoft Word has several font styles, color schemes, and shapes. You may even give the diagram a vivid background. Yet, there's still more. The program's UI is simple to use. It implies you can still use the program even if you lack the necessary abilities. This way, advanced users and beginners can operate the program. You can also save your diagram in various formats. You can save them to PDF, DOC, XPS, Web Page, and more. You can also access Microsoft Word on Windows and Mac operating systems, making it convenient.
However, you can encounter some disadvantages from the offline program. Microsoft Word doesn’t offer a cause-and-effect fishbone diagram template. You need to create the diagram manually. In addition, you cannot get the program's full features on the free version. To experience its full capabilities, you must get the paid version. Aside from that, installing it on the computer is complicated. It has numerous procedures, making it confusing for beginners. Use the method below to know how to draw a cause and effect diagram in Word.
Download and install Microsoft Word on your computer. Then, when the installation process is done, launch the offline program. After that, open a blank document.
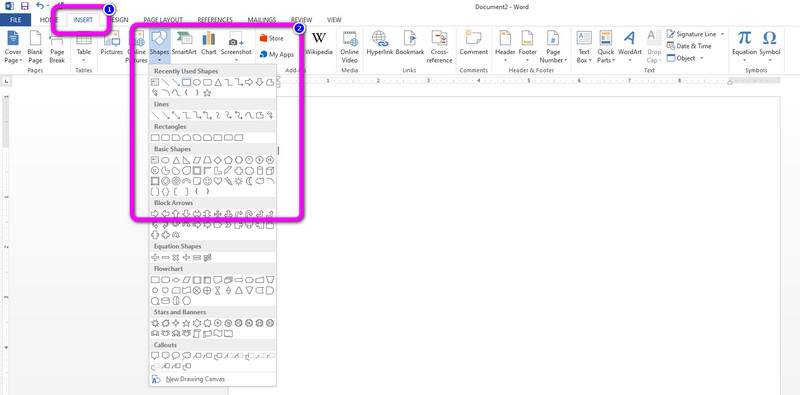
To add various shapes, navigate to the Insert tab. Then, go to the Shapes section and use all the shapes you need for your diagram.
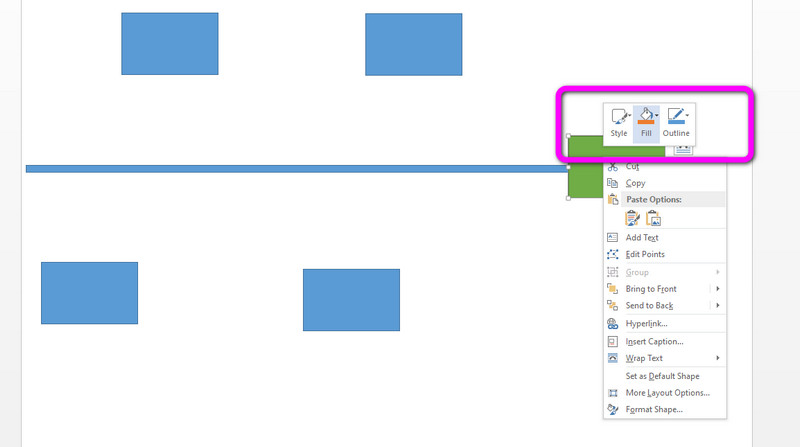
To give color to the shapes, right-click the shapes and select the fill color option. After that, choose your preferred color.
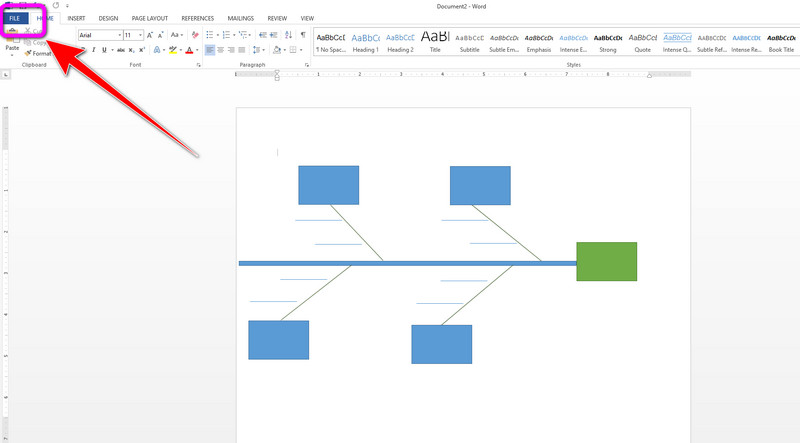
After creating the diagram, save it on your computer. Go to the top-left corner of the interface and click the File option. Then, select the Save as option and choose your preferred format. After that, the savings process will begin. After a few seconds, you can open the diagram from your computer. You also can use Word to make a Gantt chart.
Part 4. Pros and Cons of Cause and Effect Diagram
PROS
- It identifies the relationships between the causes and effects of issues.
- The technique works by utilizing group brainstorming sessions.
- Brainstorming enables expansive thinking.
- Fishbone prioritizes pertinent reasons so that the underlying, dominant root cause is dealt with first.
CONS
- For complex issues with several branching bones, a vast space is required for working out the diagram.
- It is challenging to depict the complicated interrelationships of a fishbone.
Part 5. FAQs about Cause and Effect Diagram
1. How to analyze a cause and effect diagram?
You need to see the main issue or problem first. Then, you need to think about the potential causes and effects based on the main issue. This way, you can analyze and make a possible solution to the specific problem.
2. How to produce a cause and effect diagram in Excel?
Unfortunately, Excel doesn’t offer a free template for cause and effect diagrams. To create a diagram, go to the Insert tab and select the Shapes section. Use the shapes to create the diagram. Then, right-click the shapes to insert text inside them. To put color on the shapes, use the fill color options.
3. What is cause and effect analysis?
It is the combination of mind mapping and brainstorming strategies to explore the causes of the main issue.
Conclusion
After reading this informative post, you know about the cause and effect diagram. In addition, you discovered the online and offline methods for creating a cause and effect diagram. But, if you prefer creating a diagram online, use MindOnMap. It can offer a hassle-free method for making a cause and effect diagram.