What is UML Diagram: Explore and Discover All Details about this Diagram
Are you looking for full information about the UML diagram? Well, in this article, you will learn all things about this diagram. You will discover its full definition and various types. In addition, aside from knowing the details, the post will also offer you the best methods on how to make a UML diagram online and offline. So, read the article if you don’t want to miss the opportunity to learn this type of diagram.

- Part 1. Complete Definition of UML Diagram
- Part 2. Types of UML Diagrams
- Part 3. UML Diagram Symbols and Arrows
- Part 4. How to Create a UML Diagram
- Part 5. FAQs about UML Diagram
Part 1. Complete Definition of UML Diagram
Unified Modeling Language, also known as UML, is a standardized modeling language. It consists of a collection of integrated diagrams. It is to assist system and software developers in visualizing, building, and documenting artifacts' software systems. It also includes business modeling and other non-software systems. The UML amalgamates the best engineering approaches that simulate massive, complicated systems. Creating object-oriented software and the software development process both rely on UML. The UML employs graphical notations to convey software project design. Teams can communicate, explore designs, and test the software's architectural design using UML. The unified visual representation of the UML system is shown in a UML diagram. It is to help developers or business owners understand, examine, and install their system's structure. The UML diagram has emerged as one of the most used tools for business process modeling. So, it is also very important for creating object-oriented software.
Part 2. Types of UML Diagrams
The two main UML diagram types are the Structural UML Diagram and the Behavioral UML Diagram. Each UML Diagram type has its sub-types. In this part, we will discuss them in more detail to know the primary purposes of each diagram.
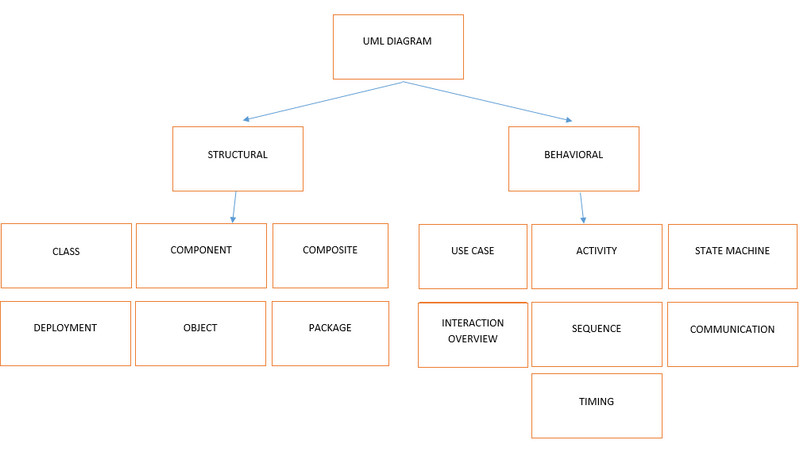
Structure Diagrams
These diagrams display several objects as well as the system's static structure. One or more abstract implementation concepts may be among the elements in a structural diagram.
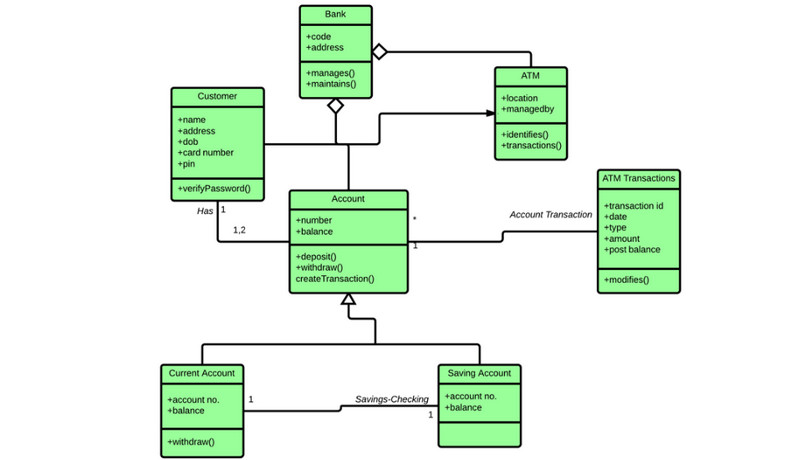
Class Diagram
It is the UML diagram sub-category that is most frequently utilized. The cornerstone of all object-oriented software systems is the class diagram. By looking at the classes and attributes of a system, users can visualize its static structure and determine how its classes relate to one another.
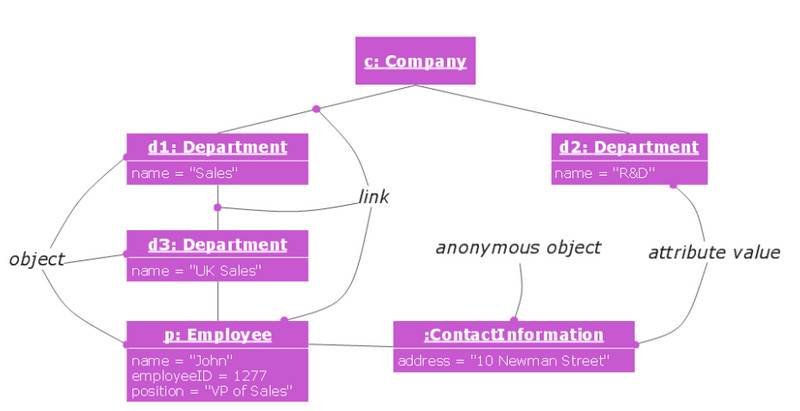
Object Diagram
This diagram helps developers to analyze the system at a particular instant. It is also to check the abstract’s structure.
Composite Structure Diagram
Composite structure diagrams display a system's internal organization, classifier behaviors, and class relationships.

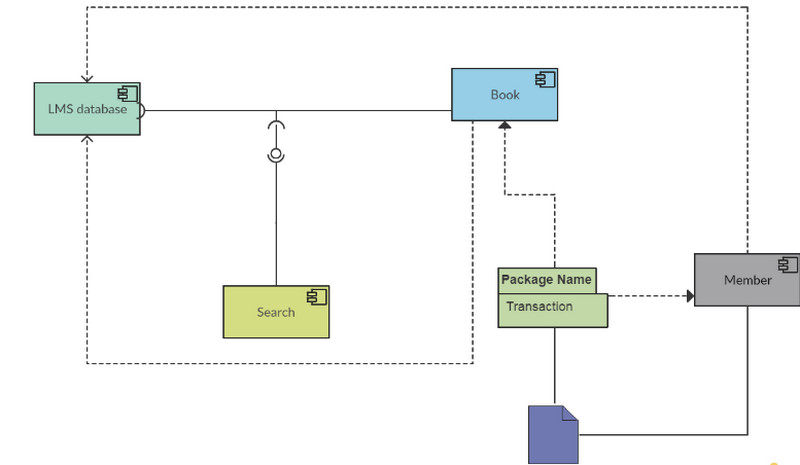
Component Diagram
A component diagram in UML shows how parts are connected to create software systems. It demonstrates the dependencies between the software components' architectures.
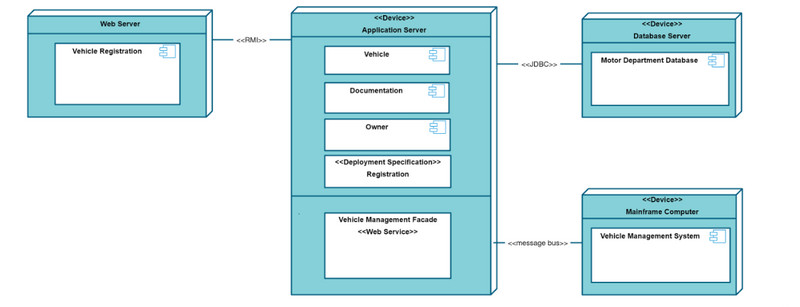
Deployment Diagram
The Diagram helps to model the physical aspect of an Object-Oriented software system. It is a diagram that shows the system's architecture as a deployment of software artifacts to the targets.
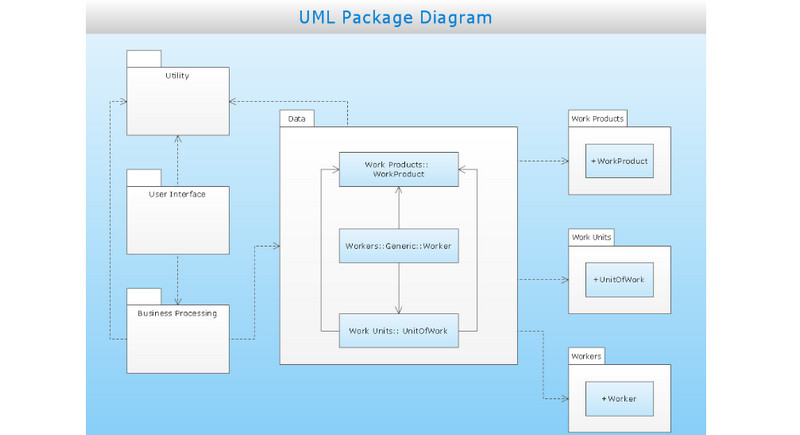
Package Diagram
A package diagram is a UML structure. It is a diagram that shows packages and dependencies between the packages. Model diagrams show different views of a system, such as a multi-layered application - multi-layered application model.
Behavioral Diagrams
These diagrams show the dynamic behaviors or what ought to occur in a system. For instance, the way things interact with one another or a series of modifications made to the system through time.
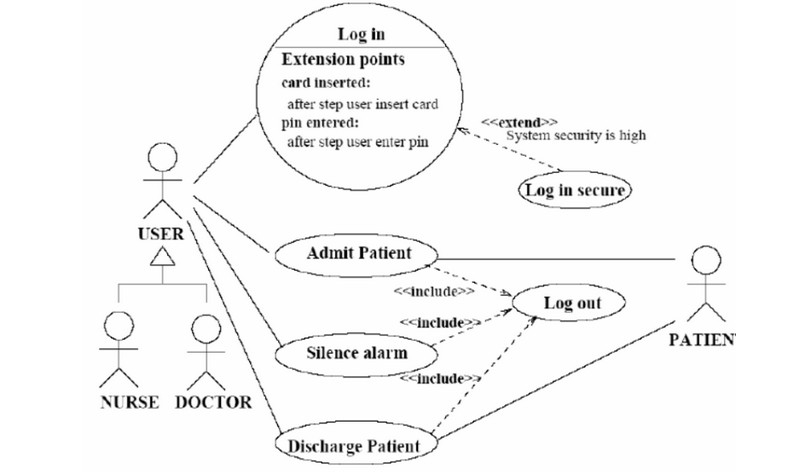
Use Case Diagram
The functional requirements use cases for a system are described in a use-case model. It is a simulation of the system's environment and expected functionality.
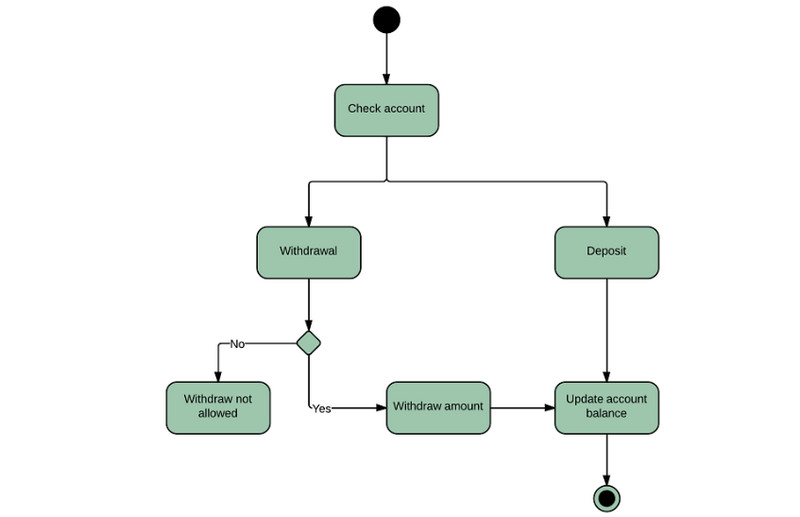
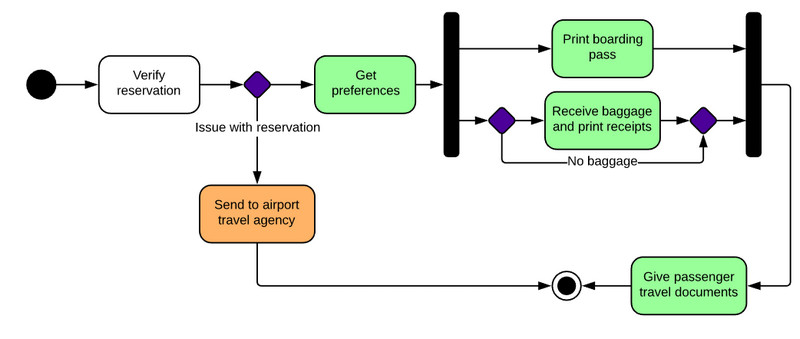
Activity Diagram
Activity Diagrams are used to illustrate the interconnected flow of different activities. It also includes actions in a system and displays the steps involved in the execution of a use case.
State Machine Diagram
It is a type of diagram used in UML to describe the behavior of systems. It is based on the concept of state diagrams by David Harel. State diagrams depict the permitted states and transitions. It includes the events that affect these transitions.
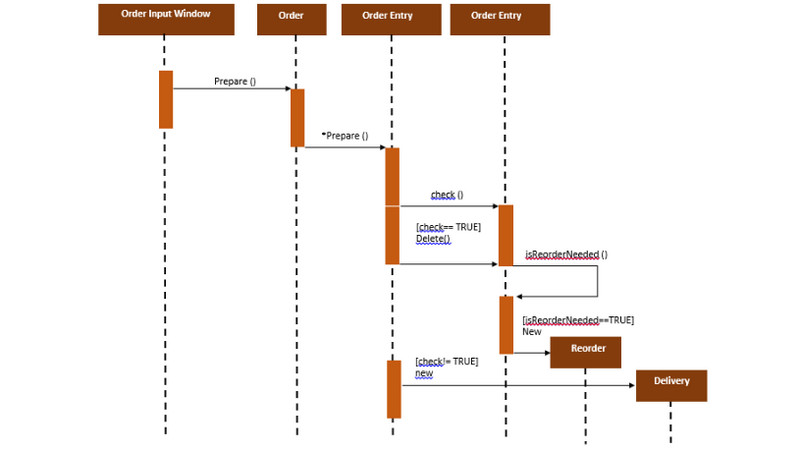
Sequence Diagram
The sequence diagram models the collaboration of objects based on a time sequence. It demonstrates how things relate to one another in a specific use-case scenario.
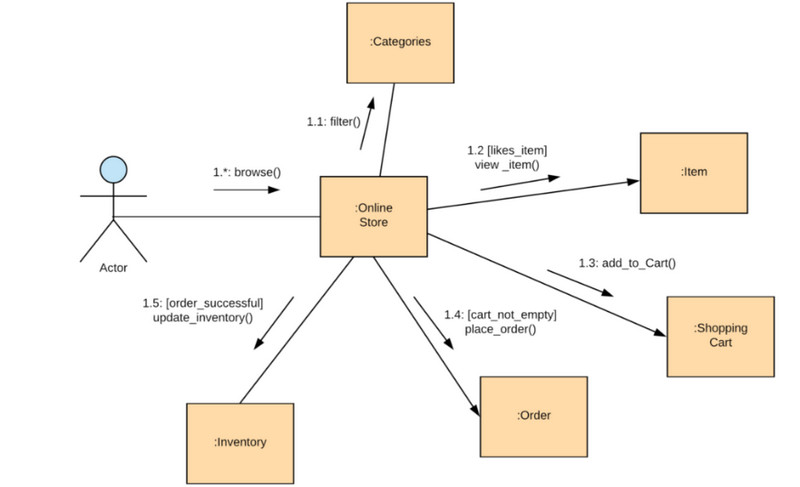
Communication Diagram
A communication diagram is employed when displaying sequenced communications between items. It includes the primary objects and their relationships as the main focus. Patterns and pointing arrows are used in communication diagrams to depict message flow.
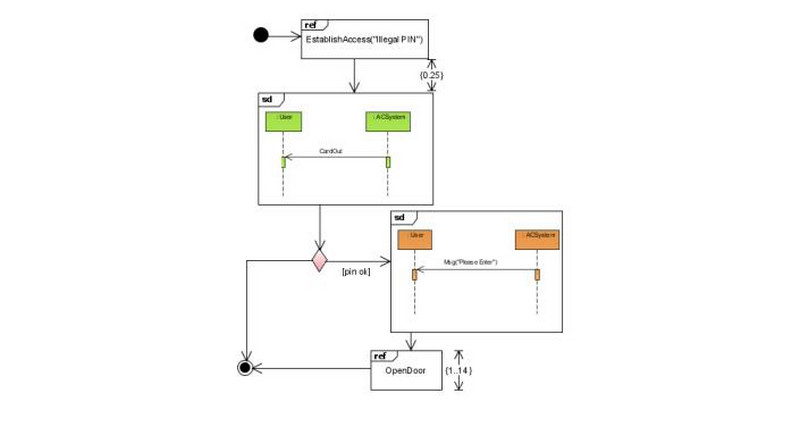
Interaction Overview Diagram
An interaction overview diagram divides a system's complicated interactions into simpler forms. It shows a series of activities. However, Interaction Overview diagrams feature more aspects than Activity diagrams. It includes interaction, time constraints, and more.
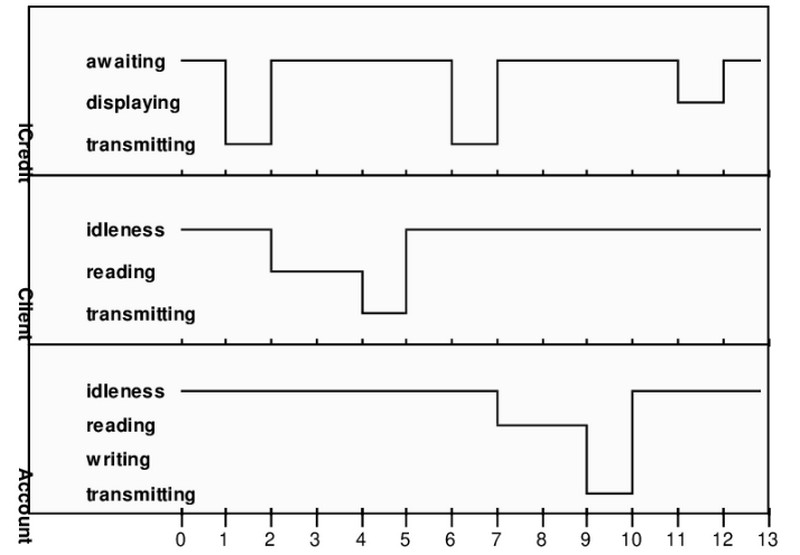
Timing Diagram
The behavior of the object/s is depicted in a timing diagram over a specified time. A particular kind of sequence diagram is a timing diagram. The axes are switched around so that time increases from left to right.
Part 3. UML Diagram Symbols and Arrows
In this part, you will see different UML diagram symbols and arrows.
UML Diagram Symbols
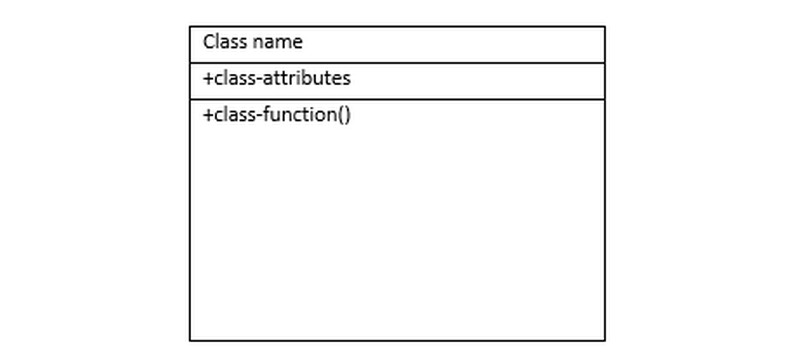
UML Class Symbol
Classes represent many objects. It is used to specify an object's attributes and functions.
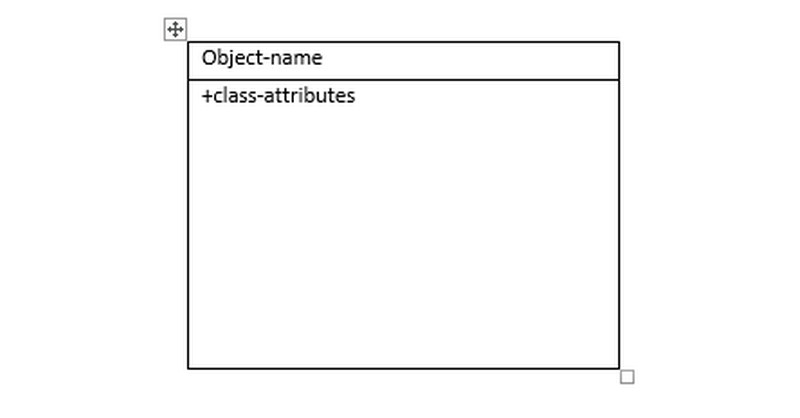
UML Object Symbol
An object is a type of entity that is used to explain a system's behavior and operations. The notations for the class and object are the same. The main distinction is that an object name is always italicized in UML.
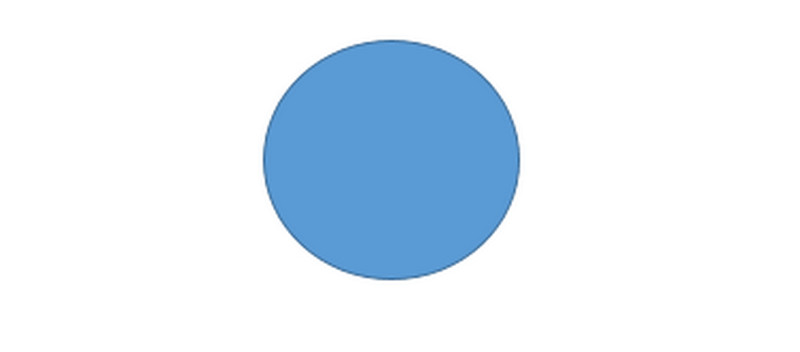
UML Interface Symbol
Similar to a template without the implementation specifics is an interface. It is shown with a circle notation. An interface's functionality is also implemented when a class does so.
UML Diagram Arrows
Association
A relationship between two classes is reflected in an association. When two classes need to communicate, and either class has a reference to the other, use the association arrow.
Aggregation
Aggregation adds extra information about the nature of the link and suggests that two groups are related.
Composition
Composition adds the following details and implies that two classes are related: within a Composition, sub-objects are highly dependent on the total.
Dependency
It is implied by a dependency relationship that two components are interdependent. When a method receives an instance of this class as an argument, it reflects how one class interacts with another.
Inheritance
When you want to demonstrate that one class inherits from another, use inheritance.
Part 4. How to Create a UML Diagram
How to create UML Diagram using MindOnMap
Do you want to create a UML diagram online but have no idea how to start? Then, the best tool we can offer you is MindOnMap. This UML diagram creator has many elements to offer when creating a UML diagram. You can use various shapes, input text, connecting lines, arrows, and more. In addition, MindOnMap offers a straightforward interface, making it perfect for all users, especially beginners. You can also access the tool on all browsers. It includes Google, Mozilla, Edge, Safari, and more. The tool is also available on mobile phones with browsers. The best thing here is that you can create your diagram for free. Moreover, MindOnMap has an auto-saving feature. It means that even if you accidentally turn off your device while doing your diagram, you can continue without starting from the first procedure.
Secure Download
Secure Download
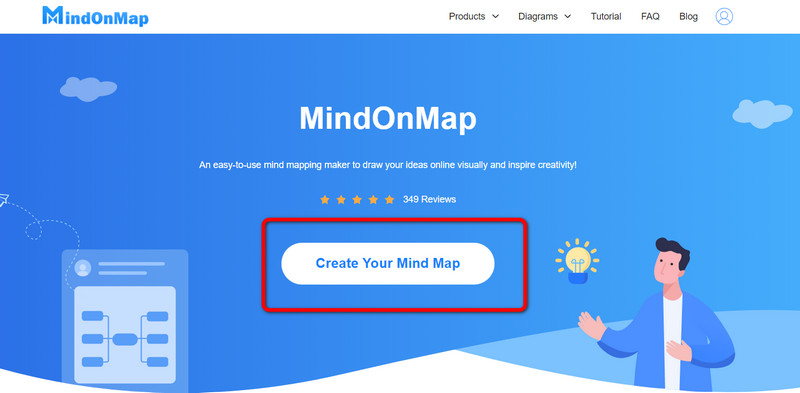
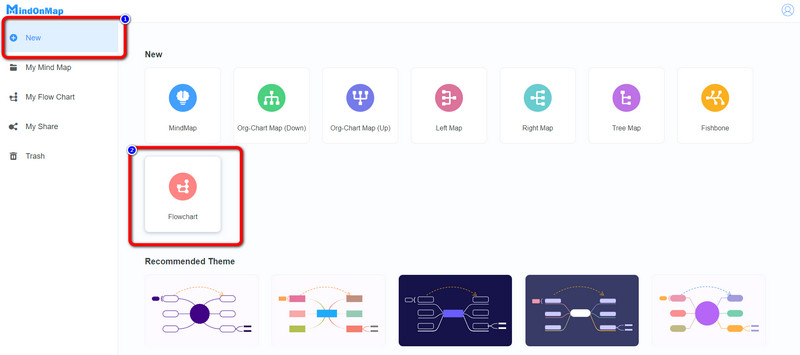
Launch your browser and visit the MindOnMap website. Click the Create Your Mind Map button. Then, another webpage will show up on the screen.
On the left side of the interface, select the New option and click the Flowchart button.
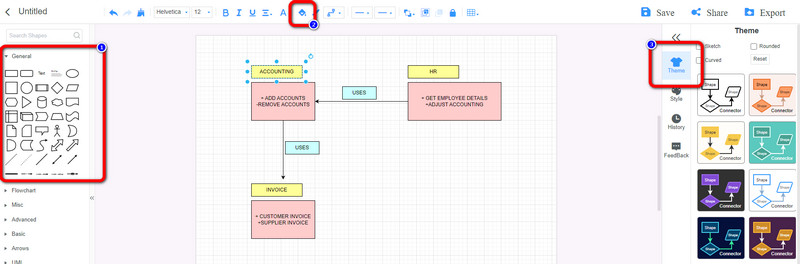
Then, you can already start creating a UML diagram. Go to the left interface to see the various shapes under the General option. Then, if you want to change the shape's color, go to the Color Fill option on the upper interface. To add text inside the shape, simply double-left-click the shape, and you can insert the text.
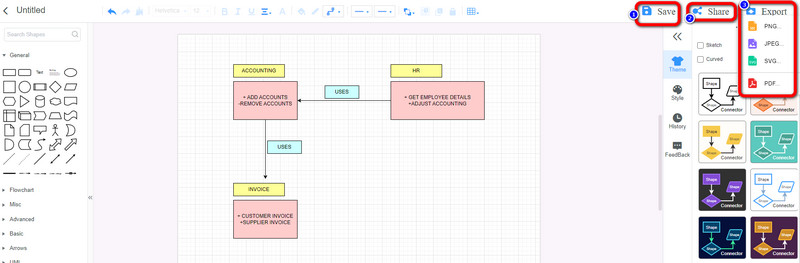
After creating the UML diagram, you can save it on your account by clicking the Save button. Click the Share option to copy and send the link to other users. Lastly, by clicking the Export button, you can save your diagram in various formats like SVG, DOC, PDF, etc.
How to create UML Diagram in Visio
Visio is one of the programs you can use under Microsoft. The program allows you to create a UML diagram effectively. However, you must sign in before using the UML diagram maker. The process takes so much time. Also, it only offers a 1-month free trial. You need to purchase a subscription plan to use the diagram maker continuously.
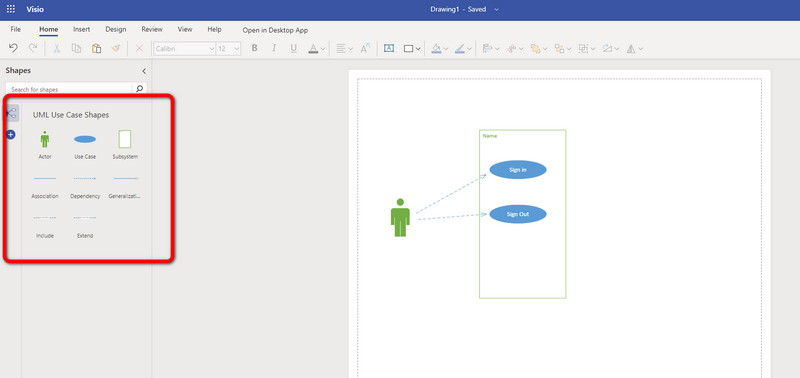
Launch Visio on your computer. Then, search the search box for any UML diagram you want to create. In this step, we will create a Use Case Diagram.
You can use the Symbols and Arrows on the left part interface. Double-click the shape to insert text inside the shapes.
When you are done creating the UML diagram, click the File > Save as menu to save the UML diagram on your computer.
How to create UML Diagram in Word
Use Microsoft Word if you want an offline way to create a UML diagram. It can offer various elements that can help you create the diagram. It can offer shapes, lines, arrows, connecting lines, and more. In addition, Word has the capability to change the colors of each shape. It means you can make your UML diagram attractive and satisfying. You also can use Word to create Venn diagrams. However, Word doesn’t offer UML diagram templates, so you need to create them manually. Also, the installation process is complicated. To enjoy its full features, you must purchase the software.
Launch Microsoft Word on your computer. Then click the Blank document.
If you want to insert shapes and connecting lines/arrows, go to the Insert tab and click the Shapes icon. You can change the color of each shape from the Fill Color option. Then, to insert text inside the shapes, right-click the shape and select the Add Text option.
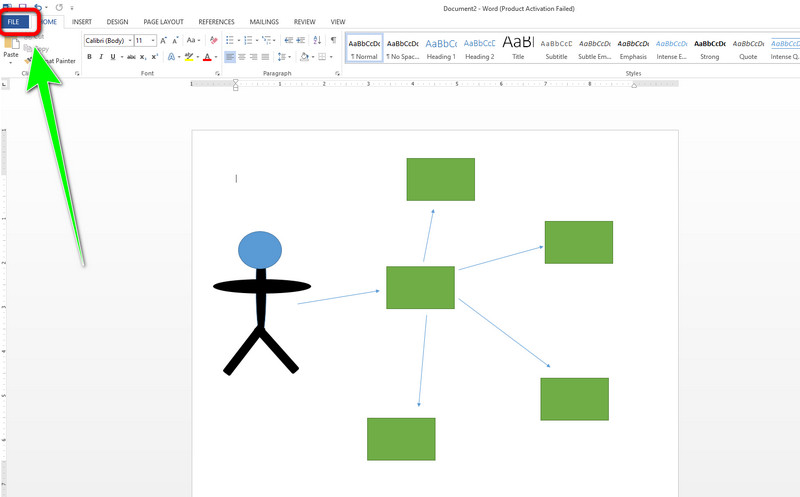
Navigate to the File menu and select the Save as option to save it from the UML diagram tool on the desktop.
Part 5. FAQs about UML Diagram
1. How to read UML diagrams?
To read a UML diagram, you must review its components and partitions. Then, you need to understand the relationship between each piece of content. This way, you can understand and enable to read the UML diagram.
2. What is the use of UML?
UML diagrams have many uses. It is excellent for business processes and workflows. In addition, it is the best replacement for flowcharts.
3. What is the importance of a UML diagram?
The importance of UML Diagram UML diagrams can be used to visualize a project before it takes place. But the primary goal of UML diagrams is to enable teams to visualize how a project will work. Also how it can help in the field, not just software engineering.
Conclusion
There you go! Now you have learned everything you need to know about UML diagrams. In addition, you discovered various types of diagrams. You also learned the best way to create a UML diagram. However, if you want the easiest way to create a diagram, use MindOnMap. It has an understandable interface and simple steps, perfect for all users.