ClickUp Gantt Chart Tutorial to Illustrate Progress of a Project
A Gantt chart is a detailed illustration of the progress of a project. It mainly displays the tasks and activities against time. Moreover, organizations and teams use it as a project management tool to be on top of the tasks and help teams complete tasks within a time frame. That said, it is essential to maintain and boost work efficiency in an organization.
Meanwhile, numerous programs are available to aid in creating a Gantt chart. Yet, if you are looking for an excellent tool offering great task management features, ClickUp is second to none. On that note, this post will demonstrate creating a Gantt chart in ClickUp. Read on to get the necessary information.

- Part 1. How to Create a Gantt Chart with the Best ClickUp Alternative
- Part 2. How to Create a Gantt Chart in ClickUp
- Part 3. FAQs About Gantt Chart
Part 1. How to Create a Gantt Chart with the Best ClickUp Alternative
Before creating a Gantt chart in ClickUp, you can try creating this chart with an online tool, a perfect ClickUp Gantt chart free alternative named MindOnMap. It is primarily a mind mapping tool that enables you to capture and illustrate events in the form of a mind map. You could apply different map layouts along with the shapes, icons, and figures to style your work.
You can choose from icons, progress, flag, and symbol icons that will make your maps clearer with symbol indicators. You can add a link or photo to a branch when inserting additional information. If you wish, you could share your maps with peers via the link. On the other hand, here is how to operate this program to create a Gantt chart.
Secure Download
Secure Download
From your web browser, launch MindOnMap. Then, you will see the program’s home page. From here, hit the Create Your Mind Map.

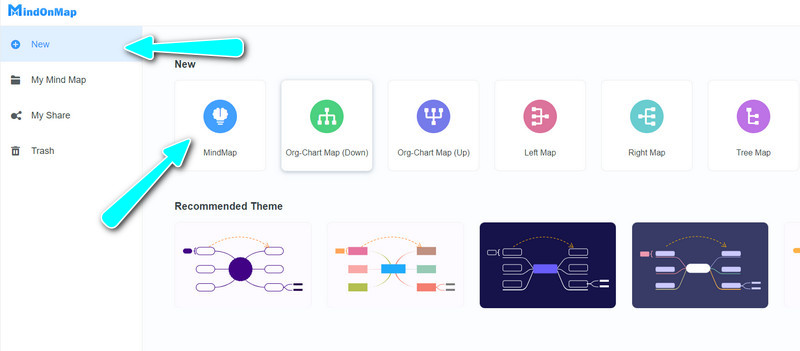
After that, you will get to the tool’s dashboard. Now, click on New and select MindMap, or you can choose your theme beforehand, so you will have a stylish map in advance without worrying about the design.
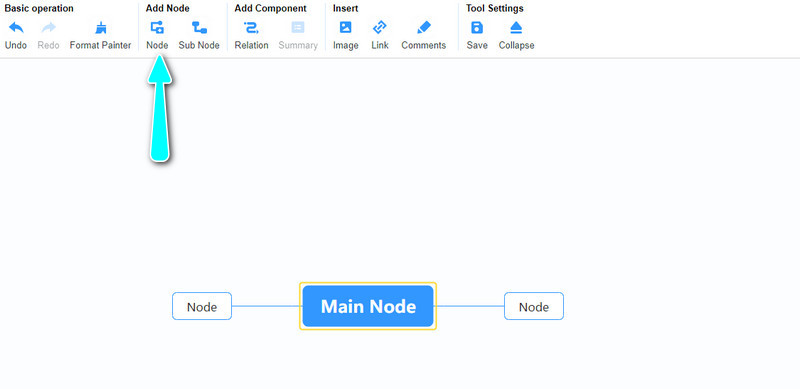
On the next page, the working editing interface of the program will be displayed. Select the central node and press Tab on your keyboard to add branches. When adding branches, you can also click the Node button on the top menu.
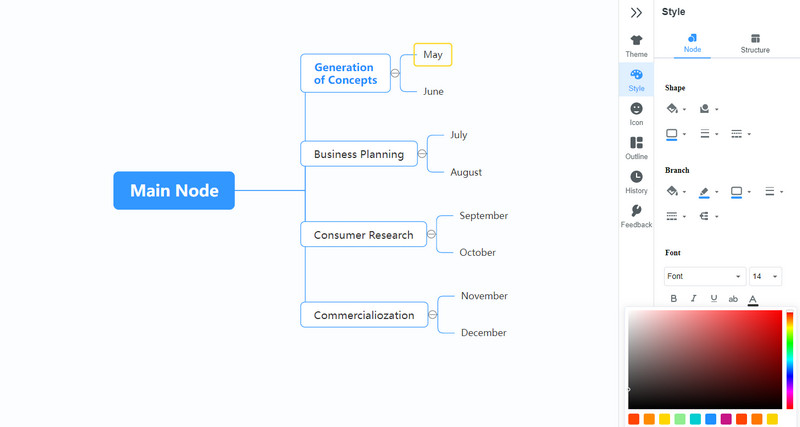
This time, key in the needed information by double-clicking on your target branch. Concurrently, customize its color, style, and alignment from the Style section on the right-side panel.
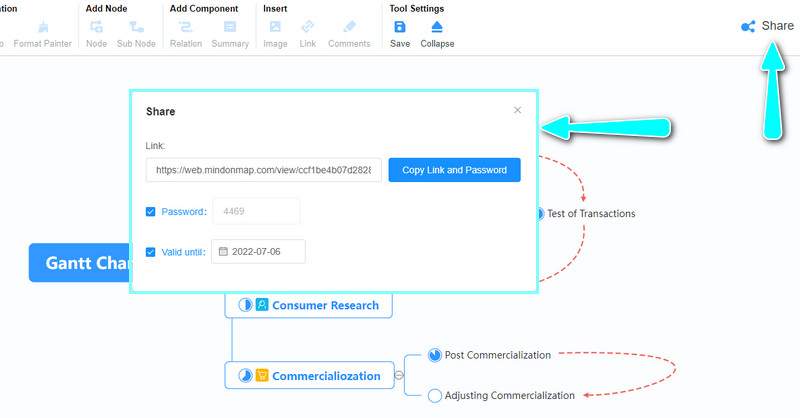
Share the map with your peers. Do so by clicking the Share button at the top right portion of the interface. Please copy the link and secure it with a password for confidentiality purposes. Then, share your work's link with your friends or colleagues.
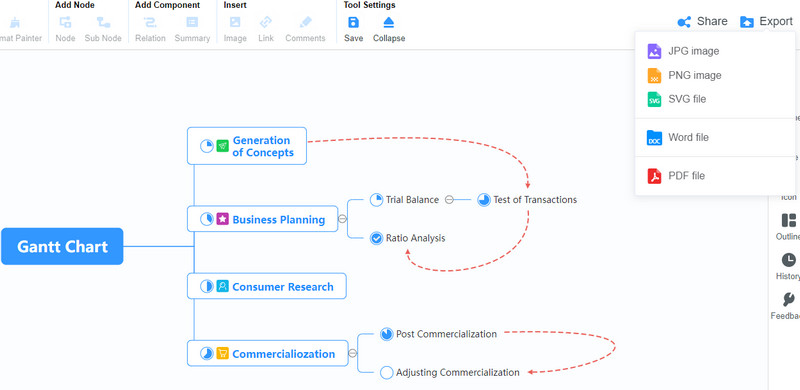
Export the map by clicking the button next to the Export button. Now, select a file format based on your needs. That is it! You have just made a Gantt chart map.
Part 2. How to Create a Gantt Chart in ClickUp
ClickUp is a wonderful Gantt chart creator with extra features that help organize and manage project plans, timelines, Gantt charts, and more. Moreover, the program comes with real-time collaboration task monitoring and editing. It is beneficial to stay on top of your tasks or activities. In line with that, this program is integrated with a comment feature that can be viewed in threads.
The project completion update in percentage allows the viewers to track the progress of a task conveniently. Apart from that, teams may also delegate tasks to members and monitor their progress. Overall, ClickUp is a good and decent program for managing tasks. If you wish to learn how to make a Gantt chart in ClickUp, follow the steps below.
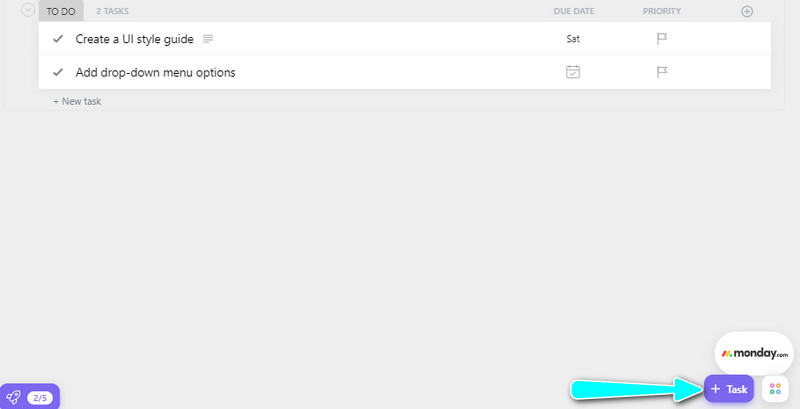
Before anything else, list the tasks or activities you need to finish. After that, categorize them according to the process. Also, you can jot down their start date and duration. You can do this by clicking the Task button at the bottom right-hand side of the interface.
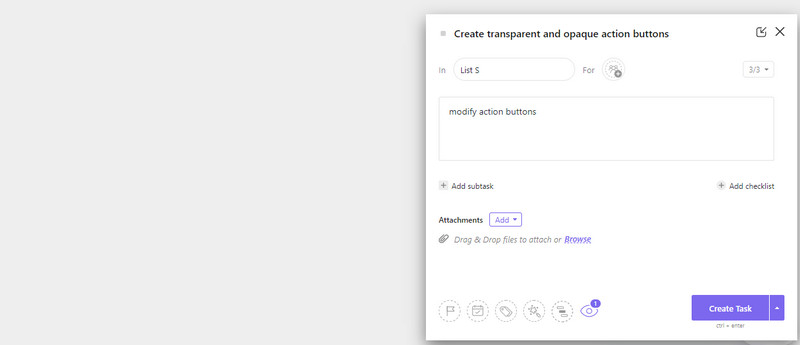
Then, from the Task box, key in the name of the task, assignee, and description. You may also add subtasks as you like. Once done, click the Create Task button. After that, it will be added to the list of your tasks.
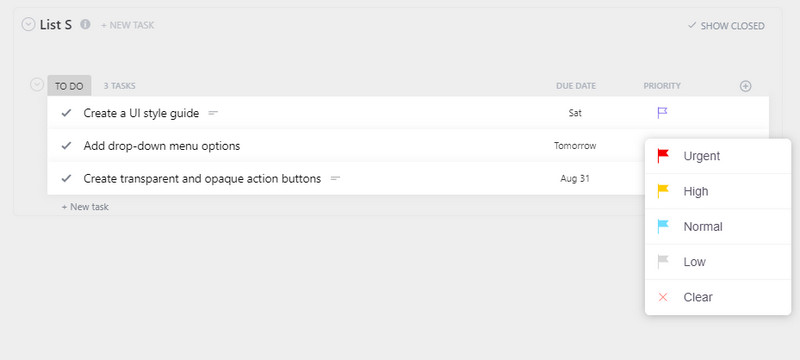
In the list, you can set the due date and priority accordingly. You can set the priority to urgent, high, normal, and low.
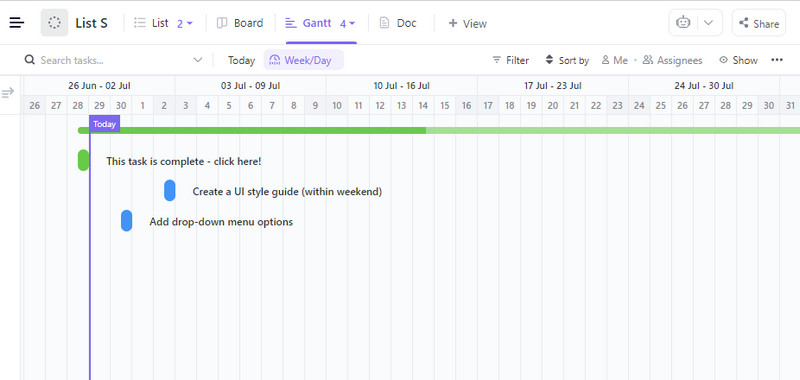
Once done, go to the View menu. From the selection, choose Gantt, followed by the Add View button.

After that, you will see that your tasks are turned into a Gantt chart, showing the data and progress. After following the steps, you should learn how to create a ClickUp Gantt chart.
Further Reading
Part 3. FAQs About Gantt Chart
What is dependency in a Gantt chart?
Gantt chart dependency is also known as task dependency. It is the relationship or linkage of a task to another task. Some sequences take place between tasks, and we call them task dependencies.
What is the difference between urgent and important tasks?
Urgent tasks require your attention immediately and come with immediate consequences when not done right now. It means the consequence will appear when it is not done at a specific time. On the other hand, essential tasks have an impact on your long-term goals. These tasks do not have an effect right away since you are time-bound.
What are some alternatives to the Gantt chart?
Gantt charts are replaceable to help you make project schedules and show dependencies. Moreover, it comes with flaws and disadvantages. Hence, you can use project timelines, network diagrams, scrum boards, checklists, and more.
Conclusion
Project managers commonly use Gantt charts to keep track of task schedules and show dependencies between tasks. A series of tasks makes it easy for teams to view the tasks to be done in an organized manner. Meanwhile, you might be looking for a program to help create a Gantt chart. Fortunately, ClickUp comes to the rescue. With it, you can have a ClickUp Gantt chart view of your tasks, making them easy to manage. Yet, if you have difficulty navigating ClickUp, you can switch to MindOnMap to make a simple and decent Gantt chart. The tutorial is prepared, so you will easily create this chart with minimum effort.