Marketing Diagram: Description and How to Make One
A marketing diagram is a visual tool that illustrates how strategies, procedures, and customer interactions connect within a business. It can simplify confusing concepts by showcasing them in well-structured formats such as graphs, flowcharts, and diagrams. So, if you are interested in learning more about marketing diagrams, including their benefits, common types, and methods to create one using the best diagram maker, read on.

- Part 1. What are Marketing Diagrams
- Part 2. Benefits of Marketing Visualizations
- Part 3. Common Types of Marketing Diagrams
- Part 4. How Marketing Diagrams Support Strategy
- Part 5. Use MindOnMap to Create Marketing Diagrams
- Part 6. FAQs about Marketing Diagrams
Part 1. What are Marketing Diagrams
Marketing diagrams are visual representations that help explain the structure, flow, and relationships within marketing strategies. Not only that, they use models, charts, or frameworks to simplify confusing ideas, such as sales funnels, customer journeys, or communication channels. By showcasing information visually, marketing diagrams make it easier for organizations or businesses to analyze processes, determine gaps, and communicate strategies comprehensively across teams.
Part 2. Benefits of Marketing Visualizations
See here and explore more about the benefits of diagrams for marketing.
Clarity of Complex Information
The good thing about marketing diagrams is that they can simplify large amounts of information into comprehensive visuals. Plus, they can help the team instantly grasp insights without getting lost in raw numbers or text-heavy reports.
Improve Communication
Another benefit is that it can improve communication. The diagram makes it easier to share strategies and results across teams and departments. Additionally, it ensures that all members can understand the same message without misinterpretation.
Enhanced Decision-Making
Since you have an excellent and comprehensive diagram, it would be easier to make decisions. Visualization supports faster and more informed decision-making. It also allows organizations to spot opportunities or risks that may not be obvious in spreadsheets. With that, for better decision-making, it is ideal to create an excellent diagram.
Better Engagement
Compared to text-based or spreadsheet-based data, diagrams are more engaging. The best marketing diagram can keep the interest of all members of the organization and other viewers. It is also helpful for marketing pitches, presentations, and client reports.
Part 3. Common Types of Marketing Diagrams
If you want to explore the common types of marketing diagrams, see all the data in this section.
Marketing Funnel Diagram
One of the common types of marketing diagrams is the Marketing Funnel Diagram. This illustrates the stages customers go through, from awareness to purchase. This diagram also helps businesses understand how prospects move through the decision-making process. By analyzing all the stages, marketers can determine where the target market drops off and optimize strategies to enhance conversions.
Customer Journey Map
This diagram or map visualizes the whole experience a target market has with a brand across different touchpoints. Plus, it shows the emotions, needs, and pain points at each stage of interaction. It also lets organizations design better experiences and strengthen customer relationships.
SWOT Analysis
SWOT Analysis diagram is an exceptional visualization tool that can show you a company's strengths, weaknesses, opportunities, and threats. With this diagram, organizations or businesses can evaluate both internal and external factors that affect marketing strategies.
Campaign Flowchart
This diagram outlines the sequence of steps in a marketing campaign, from planning to execution. The good thing here is that it shows how tasks, channels, and actions are connected to achieve campaign objectives. For more examples, explore these workflow diagram types and how they help visualize connected tasks and processes.
Currency Market Diagram
The Currency Market Diagram showcases the advantages and disadvantages of global currencies. With this visualization tool, traders/businesses can instantly identify which currencies are gaining and losing value against others, which makes it simple to spot trends and opportunities.
Part 4. How Marketing Diagrams Support Strategy
Wondering how marketing diagrams support strategy? Well, diagrams can map out complex strategies by turning abstract ideas into visuals teams can actually act on. Instead of wading through dense planning documents, everyone gets to see how moving parts, from early audience touchpoints to full campaign rollouts, fit together. This immediate clarity also makes it second nature to find quiet bottlenecks before launch.
Do you want to learn more about the difference between a marketing diagram and an org chart? Then, see the table below.
| Marketing Diagram | vs. | Org Chart |
| Visualizes strategies, processes, and customer interactions in marketing. | Purpose | Shows the structure of a company, including roles and reporting relationships. |
| Campaigns, customer journeys, funnels, SWOT, and workflows. | Focus | Departments, positions, hierarchy, and authority lines. |
| Helps analyze markets, plan campaigns, and align marketing goals. | Usage | Helps employees understand reporting lines, responsibilities, and organizational design. |
| Marketing teams, strategists, and business planners. | Audience | Entire organization, HR, and management. |
| Supports decision-making in marketing strategy and execution. | Outcome | Clarifies organizational structure and improves communication within the company. |
Part 5. Use MindOnMap to Create Marketing Diagrams
Do you want to create a marketing diagram? In that case, there is no doubt that MindOnMap can help you achieve the result you want. With this tool, you can use all the elements you need. You can create a table, add shapes, lines, text, and more. You can even create an appealing diagram with the help of theme and style features. What makes it even more ideal is that it offers a comprehensive user interface so that you can create a diagram easily and smoothly.
Furthermore, the tool can map campaigns to outline steps and goals. It can also analyze customers by visualizing their journey and behaviours. The tool can even visualize marketing plans to align strategies across teams.
So, if you want to create an excellent marketing diagram using the tool, see the instructions below.
You can access MindOnMap on your browser. If you want the offline version, you can tap the button below.
Secure Download
Secure Download
Then, from the primary interface, go to the New section. After that, you can choose the Flowchart feature to create your diagram from scratch.
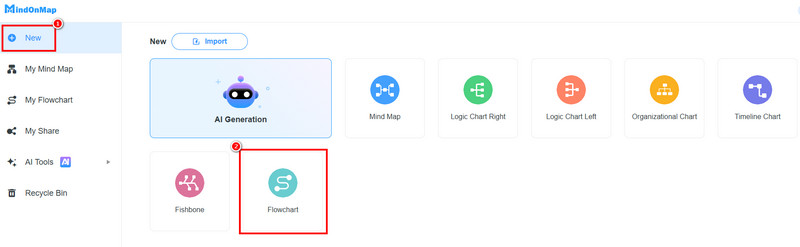
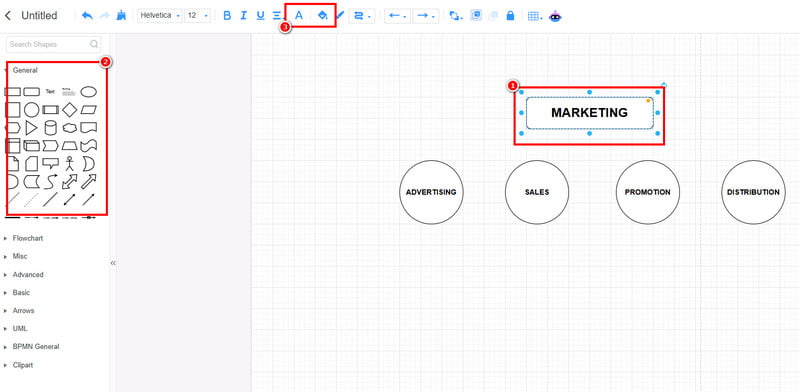
Start creating the marketing diagram. Use all the shapes you need from the General section and insert the information inside. Use the Font and Fill Color functions to add color to the shapes and text.
Click the Save button to save the marketing diagram in your account. You can also use Export to save the diagram on your desktop.
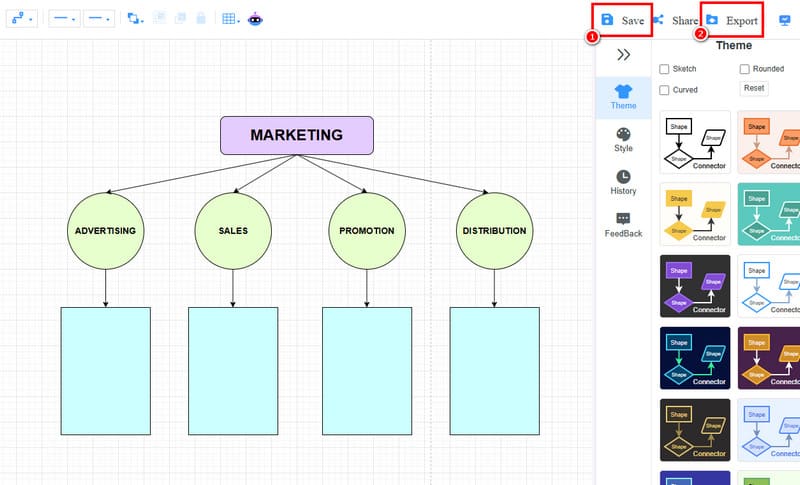
Click here to view the full marketing diagram designed by MindOnMap.
Part 6. FAQs about Marketing Diagrams
What is a Money Market Diagram?
It is a diagram that shows the relationship between the supply and demand for money in an economy. This diagram illustrates how interest rates are determined.
What is a Labor Market Diagram?
It visualizes the interaction between the supply of workers and the demand for labor by employers. With this diagram, you can explain wage levels, policy effects, and employment rates.
What is a Market Positioning Diagram?
This map shows how a product or brand is perceived relative to competitors when it comes to attributes like quality and price. The good thing about this is that it can help organizations and businesses identify their competitive advantages to adjust strategies for growth.
Conclusion
In this post, you learned everything about the Marketing Diagram, along with its benefits, common types, and how it supports strategy. You even learned how to create an ideal marketing diagram using MindOnMap. So, if you want to create a comprehensive diagram, it would be best to use this tool in your browser or on your desktop.