Probability Tree Diagram: Examples and How to Draw
Probability tree diagrams are reliable and effective visual tools that can help you break down complicated probability problems into simpler methods. This visual representation is ideal for preparing for an exam, studying statistics, or exploring probability. With that, if you want to have appealing and more comprehensive visuals, creating one is the best approach. In this article, we will provide detailed information about the diagram. You will also learn how to create one, along with its benefits and examples. If you're excited about learning more about the discussion, it's best to start reading the article right away!

- Part 1. What is Tree Diagram Probability
- Part 2. Key Features of Probability
- Part 3. Example of Probability Tree Diagram
- Part 4. How to Create a Probability Tree Diagram
- Part 5. Use Cases of Probability Tree Diagram
- Part 6. FAQs about Tree Diagram Probability
Part 1. What is Tree Diagram Probability
A tree diagram in probability is a visual tool used to map out all possible outcomes of a sequence of events, along with their associated probabilities. This visual representation is ideal when dealing with numbers. It has branches that represent each possible outcome at every stage of the process. Each branch splits further to show subsequent events, making it easy to visualize complicated probability scenarios. Additionally, tree diagrams are particularly helpful for problems involving multiple stages. It includes flipping a coin three times, as well as conditional probability, such as drawing colored balls from a bag without replacement. By breaking down the problem step by step, tree diagrams simplify calculations and lessen errors in identifying combined probabilities.
Why Use a Tree Diagram?
Well, making this type of visual representation is beneficial. It can assist you in arranging and solving probability problems. A diagram can reduce errors, provide greater clarity, and enhance understanding of a specific subject.
Part 2. Key Features of Probability
In statistics and mathematics, probability is a fundamental concept. It can measure the likelihood of an event occurring. It also plays a crucial role in various fields, including engineering, finance, and decision-making, among others. See the breakdown below and learn more about the key features of probability.
Nodes
These are the points in the diagram that represent a certain subject, state, or event. Nodes are also necessary for a person to determine the start and end points of the diagram.
Branches
These are the lines that connect the nodes. This type of element represents the possible outcome or transition between events.
Probabilities
These are numerical values for the branches. It also includes the likelihood of the outcome occurring.
Path
This feature is a specific sequence that shows the branches from the beginning node to an outcome.
Outcomes
This feature and component show the possible result on your diagram. You can see this at the endpoint of the visual representation.
With these features, you can ensure that you have a clear and understandable diagram. When creating the best probability tree, always consider using all the key factors to achieve the best possible outcome.
Part 3. Example of Probability Tree Diagram
Do you want to see an example of probability tree diagrams? In that case, you have to visit this section. We are here to provide you with the best examples to enhance your understanding. Begin reading everything below to learn more.
Probability Tree Diagram Example: Flipping a Coin

As you can see in this diagram, there are various possible results when flipping or tossing a coin. On the first flip, the probability of getting the Head side is 0.5; it is the same as the probability of getting the Tail side, since the coin only has two sides. Then, there will also be the same probability when tossing it for the second time. With that, based on the given result, you can only get at least two possible outcomes.
Probability Tree Diagram Example: Rolling a Dice
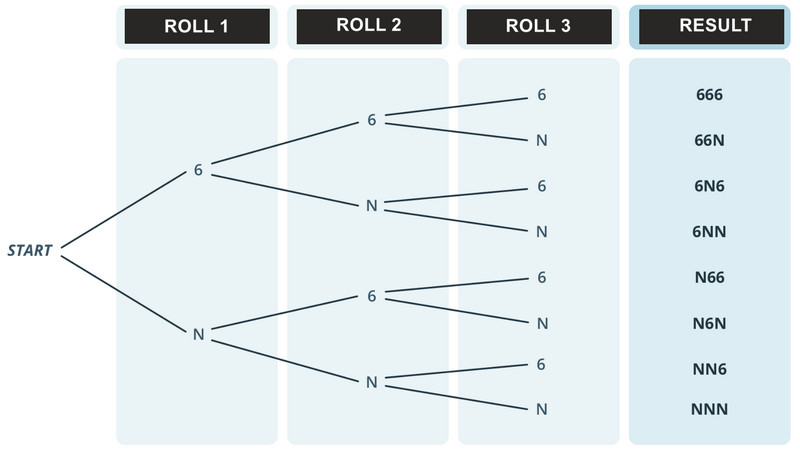
In this example, you will see the probability of obtaining a specific side after rolling the die. Since the dice has six sides, there will be six possible results, which are 1, 2, 3, 4, 5, and 6. Then, on the second and third roll, you can still get six possible results. The best part here is that the probability might change when the first to third roll can get the same possible outcome.
After viewing these examples, you can now have an idea about the tree diagram. You can also gain more insights on how to use it when searching for the probability of a specific event or subject. With that, we can tell that making a tree diagram for probability is ideal.
Part 4. How to Create a Probability Tree Diagram
A probability tree diagram generator is essential for creating an effective visual representation of complex probability models. If you're unsure which tool to use to create an exceptional diagram, we recommend using MindOnMap. This tool is ideal and perfect for creating a comprehensive tree diagram. It is because it can offer all the elements and functions you need. You can attach nodes or any shapes you want. You can also attach text, connecting lines, and more. The tool's advantage is that you can utilize its Theme or Style features to create a colorful and engaging output. You can even access ready-made templates to simplify the creation process.
Furthermore, MindOnMap also offers a collaborative feature. This feature is perfect if you want to work and collaborate with your group or team in real-time. Additionally, you can save your tree diagram in various formats. You can save/keep the result in various formats, including JPG, PNG, SVG, DOC, PDF, and more. Therefore, if you need a reliable and powerful probability tree diagram maker, you can begin using this program on your Mac or Windows.
To learn how to craft an appealing probability tree diagram, you can check and follow the detailed instructions below.
Use the Download button below to install and launch MindOnMap on your Mac or Windows.
Secure Download
Secure Download
After that, when the primary interface shows up, proceed to the New section and tap the Flowchart feature. Then, the main interface will show up after the loading process.

You can now create the probability tree diagram. Navigate to the General section to add nodes and other elements like connecting lines or arrows. Double-click the shape to add text inside.
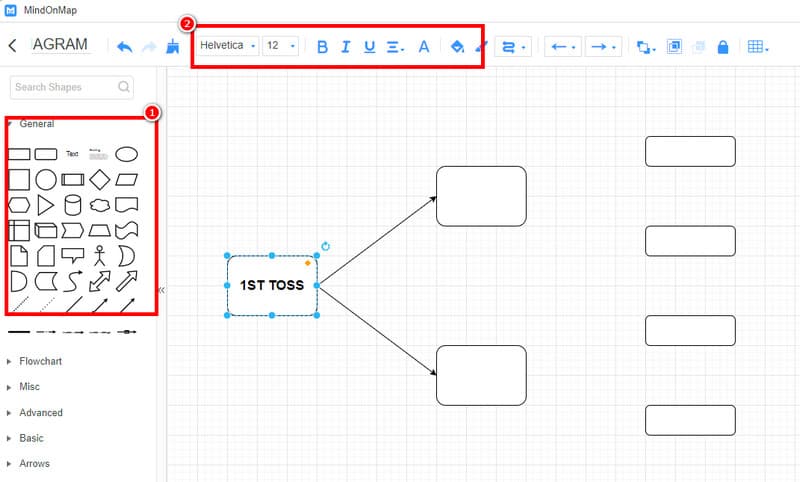
You can also use the functions above to enhance the diagram, such as adding colors and adjusting font style, size, and color.
Then, when you are done making the tree diagram, you can tap Save to keep it on your MindOnMap account. You can also tick Share to send your output to other users.
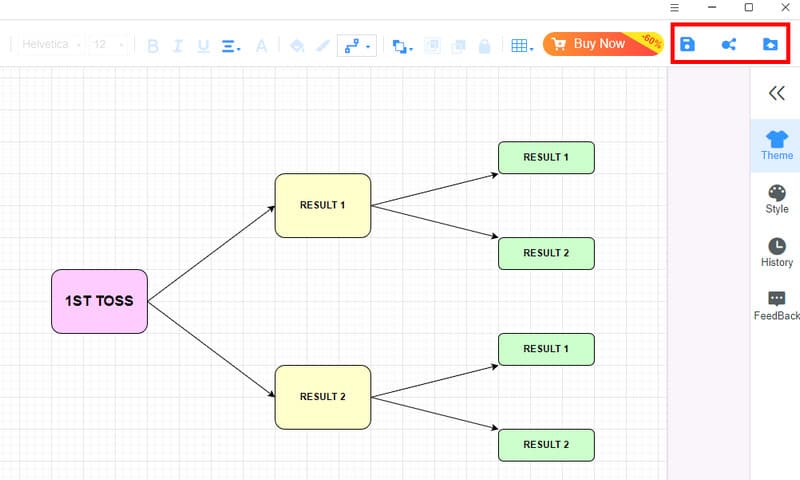
To save it on your desktop, you need to tick the Export option.
Tap here to see the complete Probability tree diagram crafted by MindOnMap.
With this method, you have learned how to make a probability tree diagram perfectly. With this great tool, you can access all the features you need, enabling you to achieve the desired output. One of the benefits of MindOnMap is that it allows you to create additional visual representations. You can use this as a family tree maker, flowchart software, org chart maker, and more.
Part 5. Use Cases of Probability Tree Diagram
The diagram can be helpful in various fields, as it enables you to map out probabilities and make informed decisions. With that, you can check some of the use cases below to learn more about where to use the diagram.
• The visual tool is ideal for informed decision-making. It can help users and others see all possible outcomes when making a certain decision.
• The tree diagram is helpful for diagnostic purposes in healthcare. It can show various possible results or outcomes based on a certain treatment.
• It is also useful for assessing financial risk. The visual tool is ideal for credit evaluation, investment portfolio analysis, calculating insurance premiums, and more.
• The probability tree diagram is ideal for educational settings. It can help students learn more about fundamental probability concepts, solve complex math problems, and more.
Part 6. FAQs about Tree Diagram Probability
What is a conditional probability tree diagram?
It is an exceptional visual tool that illustrates sequential events, where the probability of subsequent events depends on the outcome of previous events. It also illustrates how possible outcomes can influence future probabilities.
What is the importance of the tree diagram in solving basic probability?
The diagram helps users easily visualize and calculate probabilities. It can even provide you with more structured and detailed information on a specific event or subject.
What kind of probability problem is best for a tree diagram?
Well, there are various problems you can use when making a tree diagram. Some of these include the probability of getting a head or a tail when tossing/flipping a coin, the results of rolling a die, and the possible outcomes of making a decision, among others.
Conclusion
If you want to create the best Probability tree diagram, you can use this article as your go-to tutorial, as it has all the details you need. It also includes its complete description, key features, examples, and more. Additionally, if you need the best tool for creating diagrams, feel free to use MindOnMap. It can offer nodes and other features you need for an effective tree diagram-making process, making it an ideal software.