China and US Trade War Timeline: Things You Need to Know
One of the most intriguing and intricate periods in contemporary economic history is the US-China trade war. Examining its history enables us to understand its worldwide influence, from tariff conflicts to technological issues. Why not create a visual masterpiece out of the chronology to help make sense of it all?
For this, MindOnMap is the ideal tool for us to use! This tool can help us create timelines that make events come to life with its user-friendly interface. All of these details can help us study the timeline of US and China wars in an easy and effective way.

- Part 1. Why the US and China have a Trade War
- Part 2. The US-China Trade War Timeline
- Part 3. How to Make a US-China Trade War Timeline Using MindOnMap
- Part 4. FAQs about US-China Trade War Timeline
Part 1. Why the US and China have a Trade War
China's economy expanded to become the second largest in the world during this period using nominal exchange rates after the United States. The Asian Infrastructure Investment Bank, the Belt and Road Initiative, and Made in China 2025 are just a few of the massive Chinese economic projects that have some US lawmakers concerned. In general, the US administration has seen China's economic expansion as a threat to US economic and geopolitical hegemony.
The Belt and Road Initiative sought to expand China's influence across Asia, Europe, and Africa through large-scale infrastructure projects. Made in China 2025 aimed to advance domestic high-tech industries to compete globally. These aggressive things improved China's economic status for good. But, on the other hand, it also increased fear and worry in Washington that it may lose its competitive edge and geopolitical leadership position.
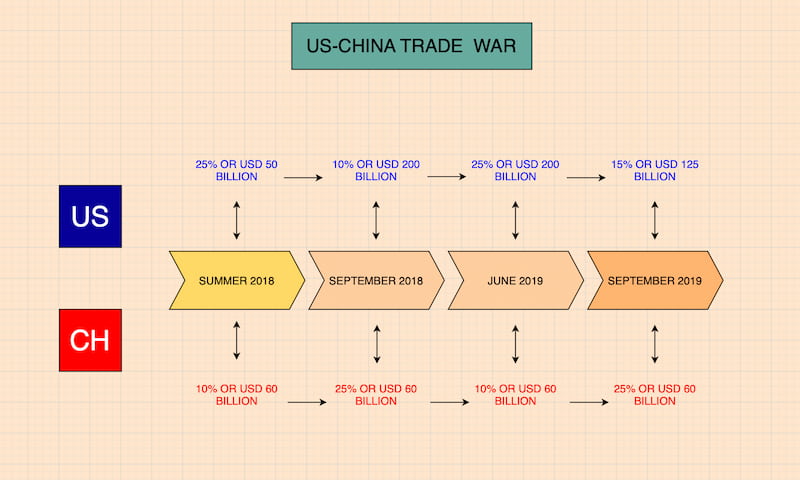
Part 2. The US-China Trade War Timeline
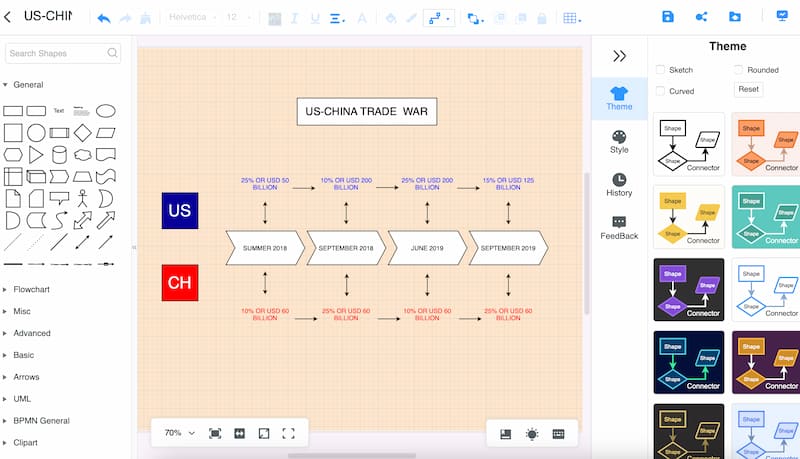
In 2018, a heated economic standoff between the two biggest economies in the world began with the US-China trade war. It all began when the United States placed tariffs on Chinese goods because China was engaging in unfair trade practices and stealing intellectual property.
China began a tit-for-tat war by retaliating with tariffs of its own. Although there was some progress in the negotiations, the dispute intensified as a result of more tariffs, limitations on tech firms like Huawei, and discussions about currency manipulation. A partial Phase One agreement in 2020 provided short-term respite, but several problems still exist. Global supply chains were altered by the trade war, which also brought attention to how precarious economic interdependence is.
More than this definition through text, we prepared a US-China trade War timeline visual created by the great tool of MindOnMap. See the chronological events with ease and study them in a bigger picture without complications.
Part 3. How to Make a US-China Trade War Timeline Using MindOnMap
Indeed, having a great visual for the timeline is a useful visual that can help us understand a certain topic much more easily. That was made possible because we have a great tool called MindOnMap. This tool is rich with features that allow users to be creative with their visual presentations of any kind of chart, like timelines, family trees, flowcharts, mindmaps, and more.
Secure Download
Secure Download
In addition, the tools are very easy to use as and drop process. In terms of shapes and elements, MindOnMap has a wide range of options to choose from. Therefore, you can create your timeline p without limitations. Let us now see how we can use it with ease.
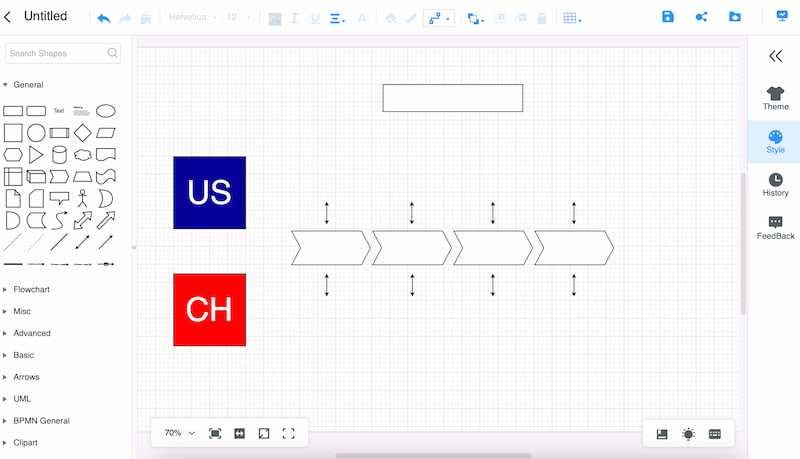
Install the amazing tool of MindOnMap from their official website. You can download it for free. From there, access the New button immediately to use the Flowchart feature.

After that, you will notice that the tool will be on a blank canvas. That means you can now start adding Shapes to it. You can add as many shapes as you want depending on your needs for the information you will add about the US and China trade war timeline.
Next, we can now start adding information about the US-China trade war using the Text approach. You can fill each shape you add. Just ensure that you added the information correctly to prevent misinformation about the trade war between the US and China.
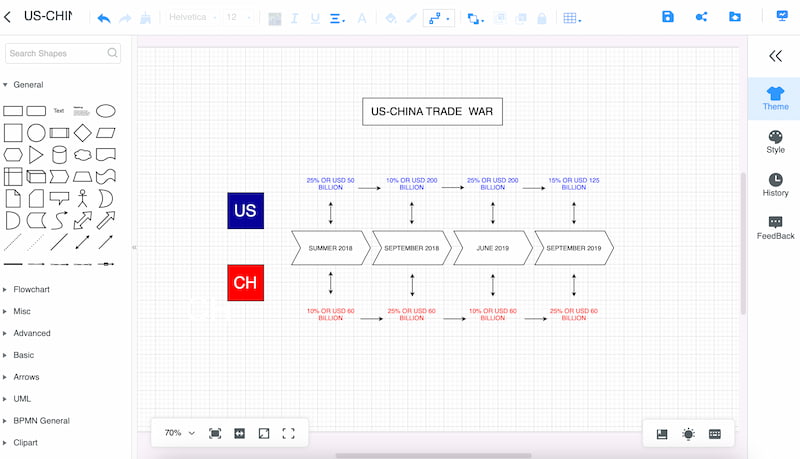
We can now finalize your family tree with the use of Themes and Colors features. Here, you can choose the details you want in accordance with your preference. You can play with a lot of colors in line with your topic.
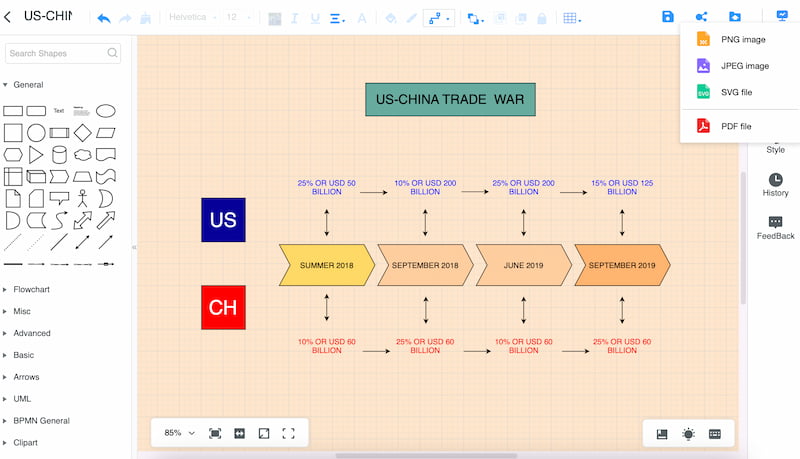
If you are good to go with your US and China trade war, we can now click the Export button. From the dropdown tab, choose the file format you need for your tree map.
There you have it, the simple way how we can use MindOnMap. Overall, we can say that the tool is indeed helpful with amazing features for free. This process above made the process of studying history easier. The best thing
Part 4. FAQs about US-China Trade War Timeline
How long has the trade war between the United States and China lasted?
Since January 2018, the United States and China have been embroiled in an economic war. In order to pressure China to alter what the United States claims are long-standing unfair trade practices and intellectual property theft, President Donald Trump started imposing tariffs and other trade obstacles on the country.
What is the impact of the US-China trade war on the world economy?
The US-China trade war, in which both countries' exports are restricted by tariffs imposed on one other, has increased world commerce by 3%, according to the National Bureau of Economic Research or NBER. This was accomplished as more goods that were expressly targeted by tariffs were traded by bystander economies.
The trade with China was initiated by which president?
In 2000, President Bill Clinton urged Congress to accept China's WTO entrance and the U.S.-China trade deal, arguing that increased commerce with China would benefit American economic interests. This agreement is the equivalent of a one-way street from an economic standpoint.
Is trade between the US and China still ongoing?
In 2022, the estimated value of U.S.-China commerce in goods and services was $758.4 billion. There were $195.5 billion in exports and $562.9 billion in imports. In 2022, the U.S. trade deficit with China in goods and services was $367.4 billion.
Who gains the most from a trade war between the US and China?
While the Americas, except the US, have benefited more from China's import substitution, Asia's global value chain, apart from China, has benefited more from US import substitution. However, the region as a whole benefits little, France is the largest recipient in Europe.
Conclusion
in conclusion, there is are lot to talk about when the topic is about wars and connections between countries and economics. With that, we can see detailed explanations of the US-China trade war. The learning process became much easier because MindOnMap offers a medium for us to create timelines without complications. Indeed, a great timeline maker for anyone timeline is a great way to present and learn faster.