Informative Details about Graphic Organizer: Learn Everything You Need to Know
As educators, we're looking for fresh approaches to support students in better-organizing ideas. A graphic organizer, for example, can accomplish this. It aids learners in organizing their planning and idea-structuring processes. A graphic organizer is an effective tool for learners. It helps them comprehend a particular topic easily. It's essential to demonstrate how to use the organizer to promote student learning. In that case, this guidepost will give you informative details about graphic organizers. In addition, while reading, you will discover the various types of graphic organizers. Moreover, we will offer you an exceptional tool if you plan to create a graphic organizer. So, to find out more about the discussion, please read the article.
- Part 1. What is A Graphic Organizer
- Part 2. Different Types of Graphic Organizers
- Part 3. Excellent Graphic Organizer Creator
- Part 4. FAQs about What is A Graphic Organizer
Part 1. What is A Graphic Organizer
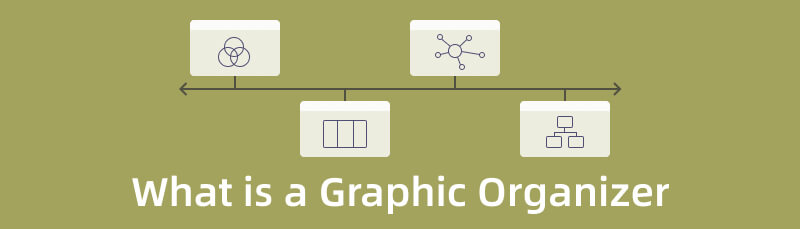
Ideas, concepts, and interactions between different components are represented visually in graphic organizers. Knowledge maps and concept maps are both categories of graphic organizers. Every graph or diagram can be used as a graphic organizer to compare data and tell a story. Creating a graphic organizer has no set guidelines. You can use it as a concept mapping tool to reach conclusions and visualize your ideas on any subject.
Furthermore, the main idea of a graphic organizer is to help learners to make their ideas clear. With the help of this organizer, things won’t get complicated. Also, there are more advantages you can get when using a graphic organizer. It can help you draw a relationship quickly between two or more components. In addition, instead of leaving the data cluttered, you can organize them through charts. It also helps learners to create a possible solution to a particular problem. There are more things you can learn when using a graphic organizer.
Part 2. Different Types of Graphic Organizers
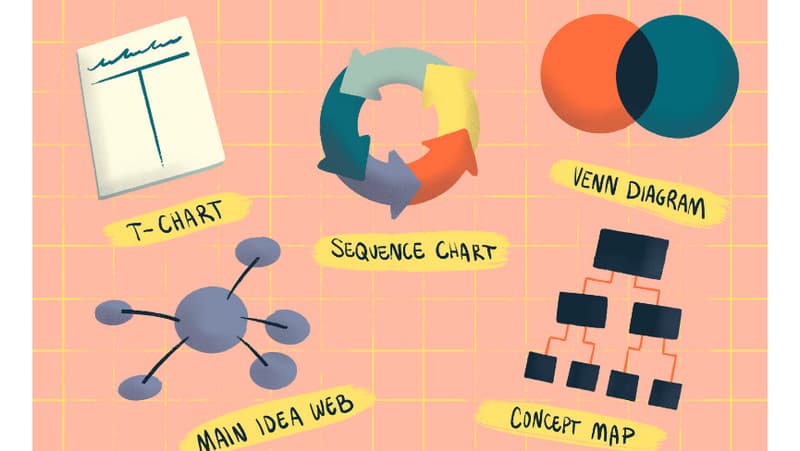
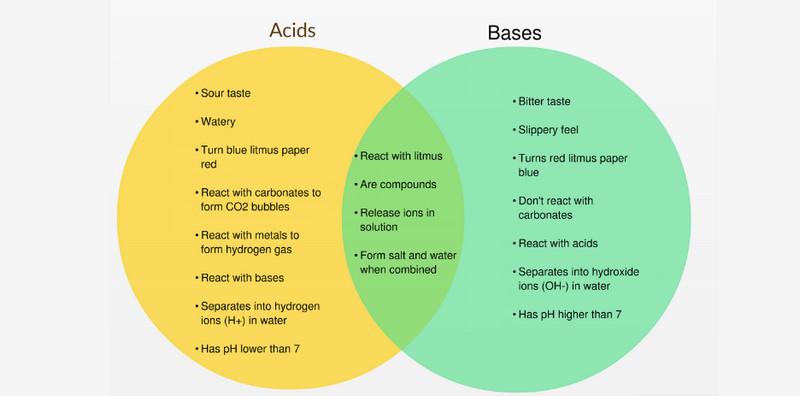
1. Venn Diagram
If you want a compare-and-contrast graphic organizer, use a Venn diagram. A simple Venn diagram has two interlocking circles. One of the main functions of a Venn diagram is to show the differences and similarities of a particular concept. For example, if you want to show the similarities in your topics, you will put them in the inner space of the circles. Then, put the differences on the sides. Moreover, you can also use two or more circles when making a Venn diagram. Creating more circles would be best if you want to compare numerous concepts. Ensure that your diagram won’t get confusing to view.
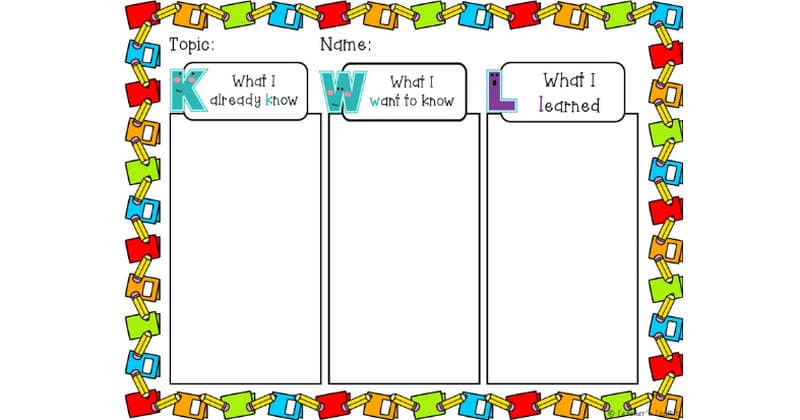
2. KWL Chart
Another well-liked visual organizer, particularly in elementary school, is the KWL chart. Three questions are presented in this visual learning tool, each in its column. First, "What I already Know." Second, "What I Want to Know," and "What I Learned" are all included. This organizer facilitates the activation of preexisting information. Both before and after understanding an idea, this organizer is used. Students list "what they want to know" and "what they know" about the subject before learning. Students then record "what they learned" in the third column of the chart after understanding the idea. This three-step procedure works wonders for giving students a feeling of purpose and increasing their interest in the subject matter.
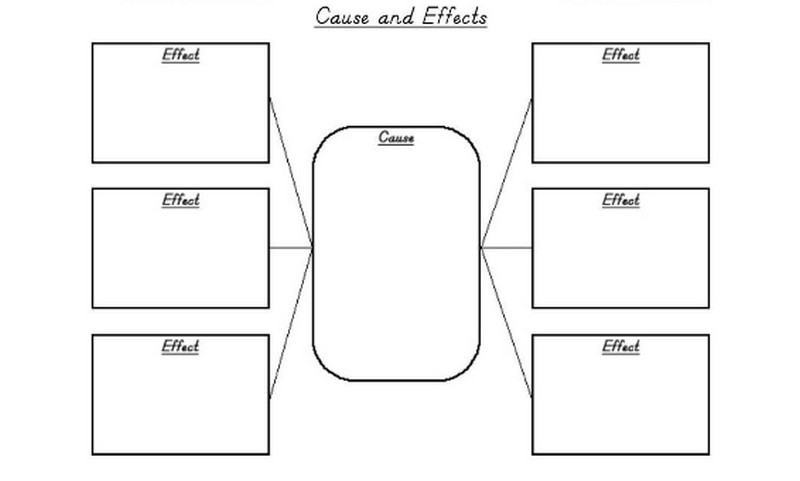
3. Cause and Effect Graphic Organizer
One excellent tool is a cause-and-effect graphic organizer. It aids pupils in organizing and clarifying complex thoughts and information. This method allows you to identify any phenomenon's causes and effects. It illustrates how many concepts or occurrences are related to one another. Teachers use this resource to assist students in understanding cause-and-effect writing. It fosters critical thought. The creation of presentations can also benefit these graphic organizers. It may be used to explain the results of different circumstances or activities. A cause-and-effect graphic organizer helps arrange the information. Investigating the origins and consequences of any issue or incident is good. The underlying causes and effects of a reading passage for a sequence of events can be illustrated using these graphic organizers. You can use different diagrams to make these graphic organizers depending on what you want to examine.
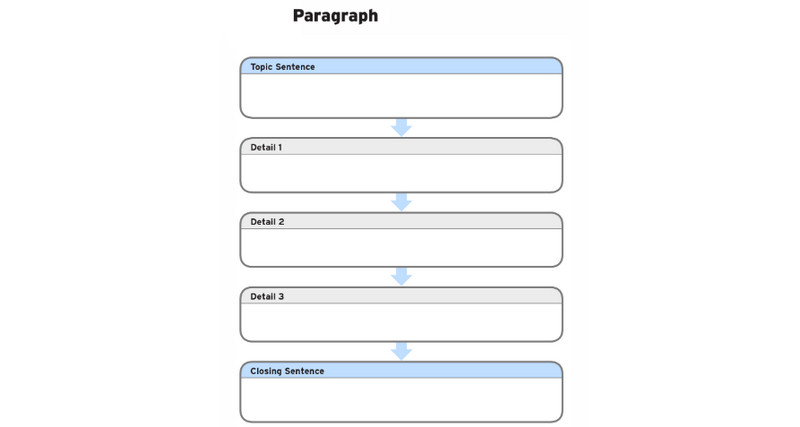
4. Graphic Organizer for Writing
A graphic organizer for writing is a tool for learning and teaching. It is helpful for literary exercises, comprehension, and creative writing. Students absorb material and concepts by organizing them with graphic organizers. Writing graphic organizers aid in the presentation and visualization of data and ideas. It is done by dividing up complex materials and concepts into manageable parts. Making connections and interconnections between various informational components also helps. Writing graphic organizers help students improve their note-taking, list-making, information-analysis, and issue-spotting abilities.
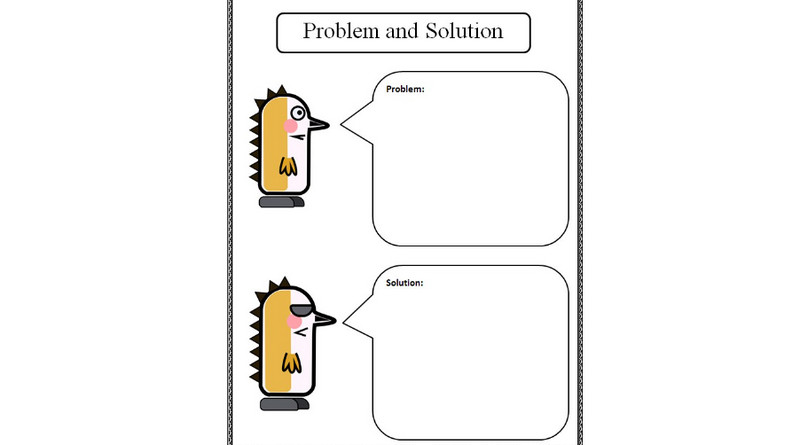
5. Problem and Solution Graphic Organizer
A problem and solution graphic organizer is good for the problem-solving process. The diagram involves writing the problems in the beginning part. The following writing will be the possible solution to the said problem. With the help of this type of graphic organizer, it will be easy for a person to arrange relevant data to the pursuable form. In addition, this problem and solution graphic organizer will serve as a guide. You can have your list of what to do and how to resolve things. It also helps people to be ready for what problems might come soon.
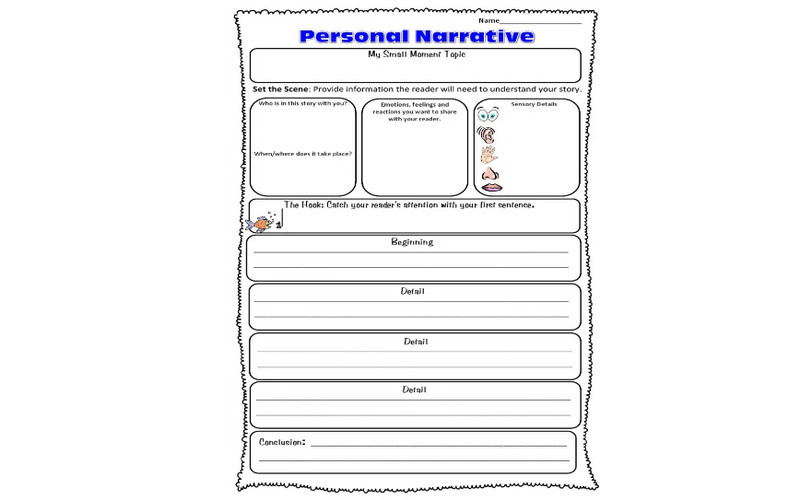
6. Personal Narrative Graphic Organizer
In personal narratives, organizing ideas before writing is a crucial step. A personal narrative graphic organizer is suitable for guiding students to explore ideas. It is also helpful in completing writing projects and for future reference. In addition, one of its benefits is removing students' and teachers' stress and anxiety. It focuses on dividing the whole exercise into small and letting the child fill in the details with a complete recount.
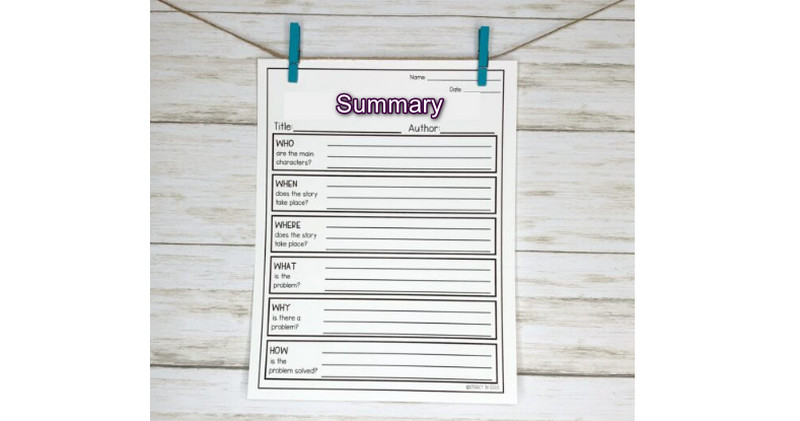
7. Summary Graphic Organizer
A summary Graphic organizer is about Summarizing text. It most often requires students to identify everything. It includes the main characters, conflict, setting, explanation of the problem, and how the problem is resolved. Using an organizer helps students focus on information and avoid extraneous details. Furthermore, this type of tool is considered a “who what when where how graphic organizer.”
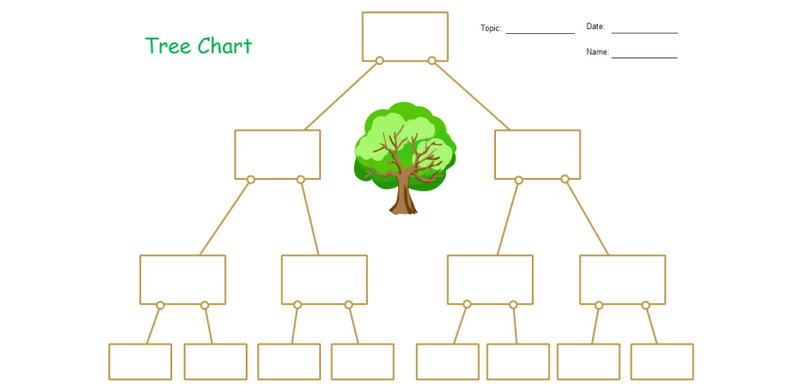
8. Tree Chart
One of the best graphic organizers is a Tree chart when organizing and classifying data. It resembles a real tree; some users even associate it with a family tree. Tree charts can help in every industry, particularly in education. In a school setting, they can help to classify concepts. The best examples are animal families or types of sentences. The upper section is the main topic or title. Then, below that are the sub-topics or qualifiers. Under the subtopics, it includes the relevant information and forms a list.
Part 3. Excellent Graphic Organizer Creator
Are you looking for an exceptional graphic organizer creator? Then use MindOnMap. This web-based tool lets you create various graphic organizers, including a venn diagram, tree chart, KWL chart, concept map, etc. Additionally, the online tool provides all the elements you need for creating a graphic organizer. It offers various shapes, like circles, connecting lines, rectangles, squares, tape, trapezoids, and more. With the help of these shapes, creating a graphic organizer would be easy. It also offers text, font styles, designs, colors, and more. You can also use free themes to create a colorful and appealing graphic organizer. Moreover, MindOnMap offers a collaborative feature. It lets you share your work with other users through links. This way, you can brainstorm with other users without meeting each other in person.
Another feature you can enjoy is its auto-saving feature. While creating your graphic organizer, the tool can save your output automatically. The tool prevents you from losing your output during the graphic organizer creation process. You can also save your final graphic organizer in various formats. It includes DOC, PDF, SVG, JPG, PNG, and more. Furthermore, MindOnMap is accessible on all web browsers, making it convenient. Follow the simple ways below to create a graphic organizer using this online tool.
Secure Download
Secure Download
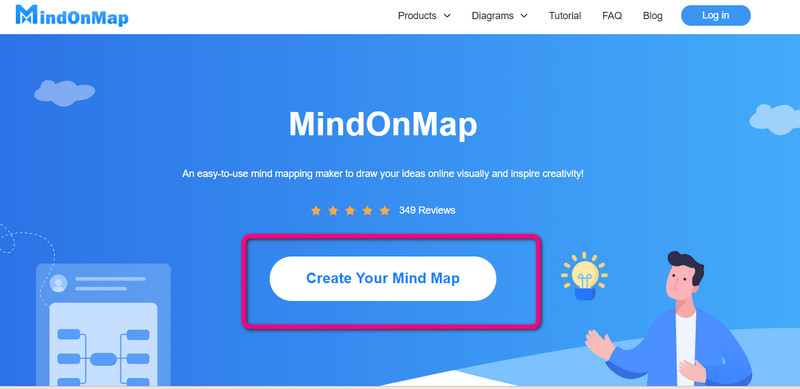
Launch your browser and visit the official website of MindOnMap. Then, create an account or connect it to your Gmail. Click the Create Your Mind Map option from the middle web page. After that, a new web page will appear on the screen.
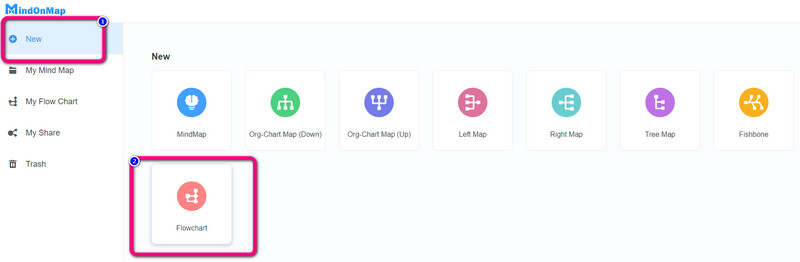
Select the New menu on the left web page and click the Flowchart icon. If you want to create a tree chart or other graphic organizer, use the free template on the options.
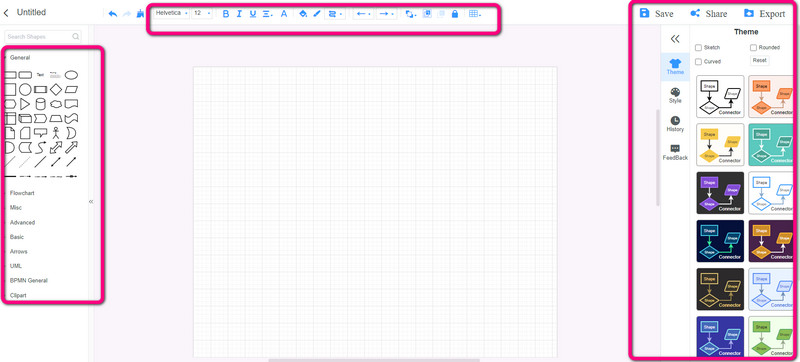
After that, MindOnMap’s main interface will show up on the screen. Go to the General options on the left interface to use various shapes. You can even click other options for more advanced tools. Double-left-click the shapes to insert text. Go to the upper interface to resize the text and add color to the shapes. The free themes are on the right interface, along with the saving options.
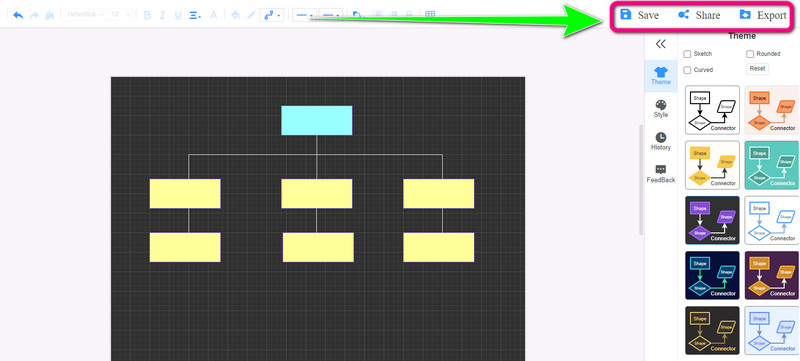
When you are done with your graphic organizer, click the Save button to save on your account. Then, if you want to share your graphic organizer with others, click the Share option. You can also export the output to other formats by clicking the Export button. You can export it to PDF, SVG, JPG, PNG, DOC, and more.
Part 4. FAQs about What is A Graphic Organizer
1. How do graphic organizers support students' learning?
Graphic organizers can be a useful learning tool. It serves as a guide for students to comprehend better what they are learning. To support students' learning, it is essential to let them know how to use the graphic organizers. In addition, students can easily organize their ideas on a particular concept using a graphic organizer.
2. How do you increase the value of a graphic organizer?
You should let the student understand the “why.” When creating a graphic organizer, you need to ask them why they must make it. Also, let the student be the designer. The learners should create their visual representation. This way, they know what to do and how they can use their logical reasoning and other skills.
3. Is there a free graphic organizer for students?
Yes, there is. The most accessible graphic organizer creator you can use is MindOnMap. It allows you to create numerous graphic organizers without purchasing a subscription plan. Besides, it is suitable for students because of its intuitive interface. It also has simple methods for creating a graphic organizer.
Conclusion
This article gives you complete information about the graphic organizer. You also discover the various graphic organizers you can use for visualizing concepts or organizing ideas. However, some of the graphic organizers are complicated to create. That’s why this post also offers an excellent tool you can use. So, if you plan to create a graphic organizer, it would be best to use MindOnMap. It offers an easy-to-understand interface and is 100% free, making it accessible to all users.