BCG Matrix Example, Definition, Calculation [+ Template]
In the business world, knowing which products to invest in and to let go is essential. No one wants to waste their money and resources on things that do not grow. Thus, you have to make the best decisions for your product or services. A tool like BCG matrix can help you with that. Many asked, “what does the BCG matrix evaluate?” If you’re one of them, you are in the right place. Read here to learn its definition, advantages, disadvantages, and how to compute. Besides that, discover the best way to make its diagram.

- Part 1. What is BCG Matrix
- Part 2. Advantages and Disadvantages of BCG Matrix
- Part 3. How to Calculate BCG Matrix
- Part 4. FAQs About What is BCG Matrix
Part 1. What is BCG Matrix
The BCG Matrix is also referred to as the Boston Consulting Group Matrix. It’s a model that guides companies in making decisions about their products and services. It divides them into four groups: stars, question marks, cash cows, and dogs. Also, it helps businesses figure out product prioritization and resource allocation. It's like a map to guide them in making smart decisions. At the same time, it makes you successful in the competitive world of business. There are two things that the BCG matrix evaluates, and these are:
1. Market Share
A factor that looks at how the market for a product or service is growing. It assesses the potential for future sales growth in that market. Also, it categorizes the products and services as high, medium, or low market growth.
2. Market Growth Rate
A factor measuring a product's or service's market share compared to its competitors. It helps determine a product's competitive strength in the market. It also categorizes the product or service as having a high, medium, or low relative market share.
BCG Matrix Example: BCG Matrix of Nestlé
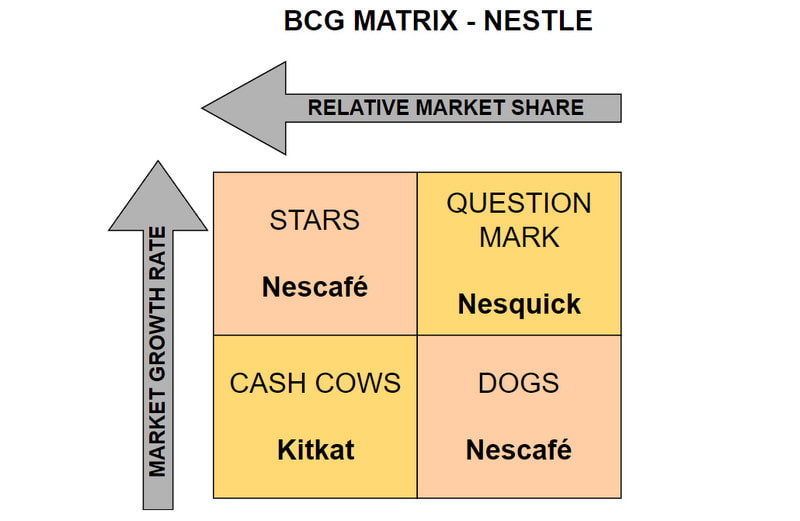
Get a complete BCG Matrix diagram example.
Stars - Nescafé
Nescafé is expected to make more returns in the future. Yet, it needs a lot of investment to get there. As a result, it could become cash cow products.
Cash cows - KitKat
KitKat has lots of loyal customers, especially in Asia. It doesn't need much investment because it's already everywhere, and people love it.
Question marks - Nesquik
Some of Nestlé's milk products are in a tough spot. They need more investment, and it's a risky decision to do that. It is also because they are in the strategy department process.
Dogs - Nestea and others
These products don't have significant benefits. So, investing more in them doesn't make sense. They might become more important in the future, or they might not.
BCG Matrix Template
Now, take a look at a BCG Matrix template that we’ve prepared for you to use.
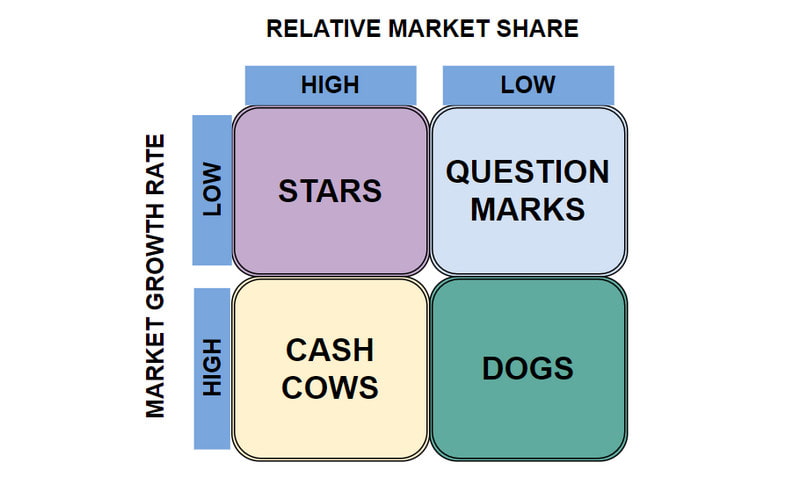
Get a detailed BCG Matrix template.
Part 2. Advantages and Disadvantages of BCG Matrix
Advantages of BCG Matrix
1. Simple to Implement and Understand
It's a good idea to use tools that everyone in your company can use and understand. BCG Matrix is simple. It puts each product into one of four categories. Thus, it gives clear results that your team can use to make plans.
2. Resource Allocation
It helps you figure out where to put your company's limited resources. So that you could make the most profit and grow in the long run. Also, it suggests spreading your products across different markets and types. Investing in products with growth potential boosts future profits and business growth.
3. Balance Your Portfolio
BCG Matrix helps companies ensure that they have a good balance of products. Lack of products in fast-growing markets can hinder long-term success and profits. So, use the matrix to see where your products are in their markets. Keep a balanced portfolio with both current profit generators and future high-earning potentials.
Limitations of BCG Matrix
1. Inaccurate Predictions
The Boston Matrix can lead to inaccurate predictions. Market share doesn't always tell us how much profit a product makes. Sometimes, products with lower market share earn more.
2. Inexact Measurement
The Boston Matrix uses basic measures for complex ideas. It assumes that fast-growing markets are always better, but that's not true. This makes the tool sometimes not very accurate. Also, it doesn't always show the true value of products. For example, a 'star' product may not always be more valuable than a 'dog' product.
3. Short-Term Focus
The Boston Matrix doesn't look far into the future. It only looks at market share and market growth rate right now. So, it might not be good at telling us what will happen in markets and with products that change quickly.
4. Ignores Outside Factors
The Boston Matrix doesn't think about external factors of the market and the product. New technologies or rules can change a market fast, making it less profitable. Political issues can also affect products and markets. To understand the BCG Matrix, you need to think about these things too.
Part 3. How to Calculate BCG Matrix
Step #1. Identify Products or Services
Make a list of the products or services that you want to analyze within your portfolio.
Step #2. Calculate the Relative Market Share
Determine your own market share for each product within its respective market. Calculate your market share relative to your largest competitor. It also helps to classify products as having high or low market share.
Formula: Product’s sales this year/Leading rival’s sales this year
Step #3. Determine Market Growth Rate
Assess and classify the market for each product as high, medium, or low growth. Here, it involves evaluating how the market is expanding or slowing down.
Formula: (Product’s sales this year – Product’s sales last year)/Product’s sales last year
Step #4. Plot on the Matrix
Place each product on the BCG Matrix. Based on its market growth rate and relative market share. The matrix has four quadrants: Stars, Question Marks, Cash Cows, and Dogs.
Step #5. Analyze and Plan
Once you plot your products, analyze the results. Stars have high growth and market share, requiring investment. Question marks have high growth but low market share. So, it requires consideration for further investment. Cash cows have a high market share yet low growth, generating revenue. Dogs have low growth and market share. Thus, you may need to decide whether to divest or maintain them.
How to Make BCG Matrix Diagram with MindOnMap
How to create a BCG-Growth Share Matrix diagram? Well, MindOnMap can help you with that. It is a free web-based platform that lets you create any diagram. It makes your chart-making easier, quicker, and more professional. The tool also offers several premade templates that you can use. You can make an organizational chart, fishbone diagram, treemap, etc., with it. Further, it lets you use the shapes and elements provided to make your work personalized. The notable feature of MindOnMao is its auto-saving function. It enables you to save all the changes you made in your creation. Finally, the tool also has an app version. It means you can also download it on your Windows or Mac computer. To know how this tool works, here’s a simple guide for you.
First, navigate to the official page of MindOnMap on your favorite browser. Choose what you prefer: Free Download or Create Online. Then, create an account if you don’t have an existing account on it.
Secure Download
Secure Download
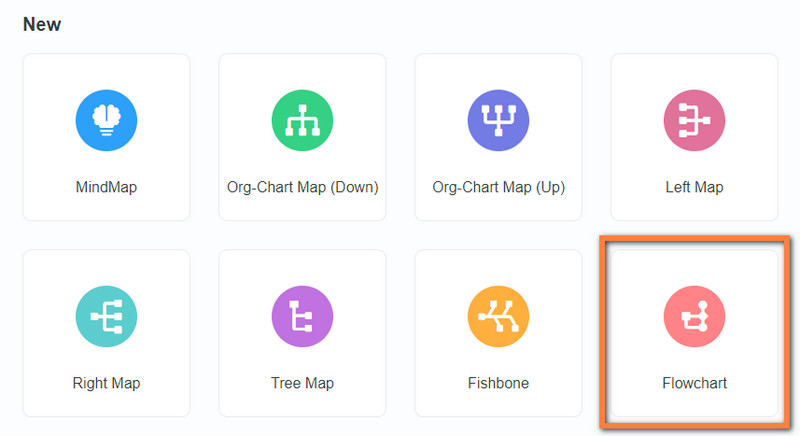
Once you access the tool’s interface, click the Flowchart option. We chose the flowchart layout to create the BCG Matrix chart with ease.
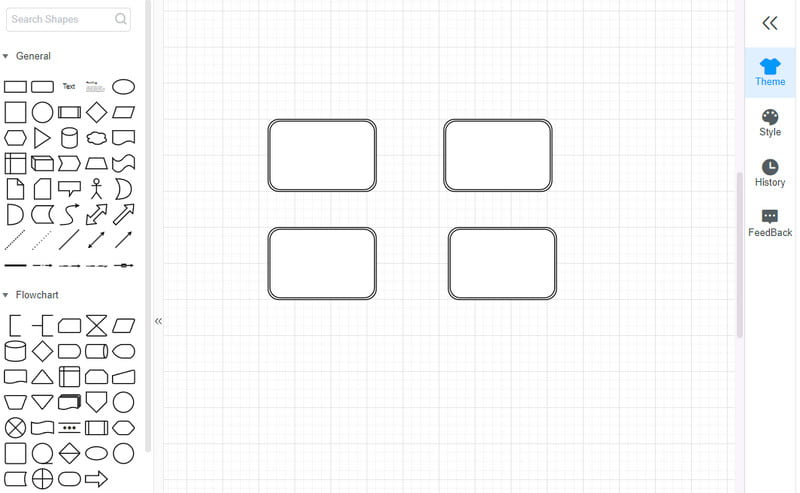
In the following section, begin creating and customizing your diagram. Add the shapes, texts, lines, etc., for your BCG matrix diagram. You can also select a theme for your chart.
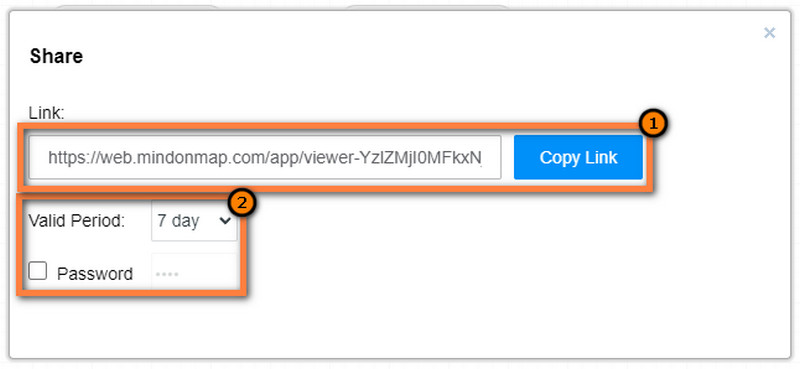
To collaborate with your colleagues on whatever you’re working on, click the Share button. That way, you can have more ideas on what to add to your matrix. Next, set the Valid Period and Password. Finally, hit the Copy Link button.
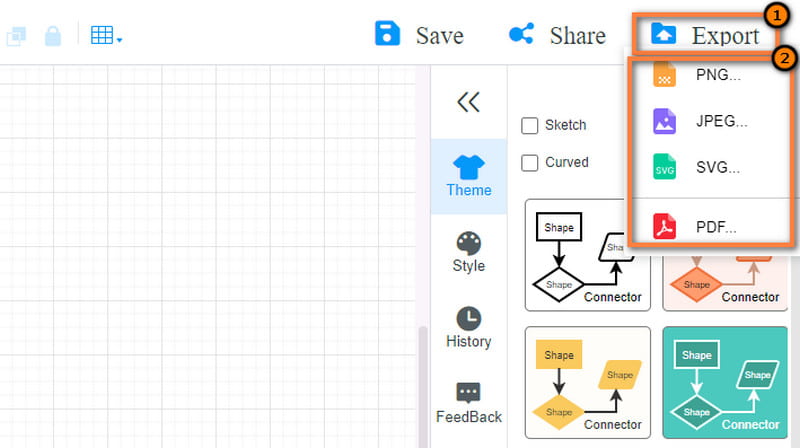
When you’re done, save your work on your computer by clicking the Export button. Then, choose the output format you desire to execute the process. And that's it!
Further Reading
Part 4. FAQs About What is BCG Matrix
What is the BCG matrix for market share?
The BCG Matrix contains four quadrants. It is based on the analysis of market share and market growth rate. So, market share is an important part of the BCG Matrix.
What is the BCG matrix of Apple?
Apple’s iPhone is their flagship product. So, we can say that it is Stars in the BCG Matrix analysis. As for its Cashcow, it’s the MacBook. Its quality is well-known, thus its high selling price. Apple TV, on the other hand, has a low profit now. It cannot keep up with its competitors, which makes it a Question Mark. Finally, the iPad is the Dogs in the BCG Matrix, for its growth is low.
What is the BCG matrix Coca-Cola?
Stars like “Dasani” represent Coca-Cola's bottled water. They have the potential for growth if they invest in marketing. Coca-Cola itself is the long-standing leader in carbonated soft drinks. Thus, it makes it the Cash cow in the matrix. Yet, Fanta and other beverages serve the Question marks. These products need advertising and quality improvement. Finally, the Coke is considered the Dog. It is because they are less profitable. Also, it might be dropped since many consumers prefer Coca-Cola Zero.
Conclusion
By now, you’ve learned the BCG definition, template, example, benefits, and limitations. Not only that, you got to know the best diagram maker. MindOnMap is indeed a dependable tool for creating a BCG matrix chart. It offers an intuitive interface, allowing professionals and beginners to use it for their needs. So try it today to know its full capabilities!