6M Fishbone Analysis: Diagram Definition, Explanation, and Templates
There are benefits of using quality tools such as 6M analysis for an individual or organization. The primary purpose of having a 6M analysis is to identify the cause and effect of why an event is happening through a diagram. Managers, organizations, or even typical individuals utilize this tool to overview the situation. With it, you can look at the problems in multiple ways to gain clarity and make wise decisions.
Bear in mind that a single cause may fall into various categories. Speaking of categories, it allows you to rank and separate the specific causes for an in-depth overview of the effects and problems. In this case, the 6M fishbone approach is of great help. In this post, you will have a deep understanding of what 6M analysis is, how it is valuable, and how you can make one for your decision-making. Keep reading to get the needed information.

- Part 1. What is 6M/6M's Analysis?
- Part 2. The use of 6M in Cause and Effect Analysis
- Part 3: 6Ms Analysis Examples
- Part 4. How to Mind Map with 6M Analysis
- Part 5. FAQs on 6M Analysis
Part 1. What is 6M/6M's Analysis?
The 6M/6M's is a mnemonic tool that helps you find the root causes of a problem or an event. It is usually seen in brainstorming about problem-solving and decision-making. To uncover the root cause of a problem or variation, 6M analysis helps you evaluate all the possible process inputs and assess them properly. Moreover, it adheres to the Fishbone Diagram approach, also known as the Cause and Effect diagram.
In fact, the 6M method is beneficial in dissecting any industrial problems. You will learn what 6M is in management based on the following parameters.
Method: The production and support processes necessary to generate an output or service delivery. Here, you can consider your processes that take too many steps that do not contribute to the system.
Material: This includes the components, raw materials, and consumables you need to deliver a service or generate a product. Its purpose is to check whether the product materials have correct specifications, subsequent usage, labeling, and proper storage.
Measurement: If you are asking what a measurement is in the fishbone diagram, this is the parameter for evaluation, inspection, and physical measures, including both automatic and manual. This helps the organization preserve consistency in generating products by keeping keen on the calibration errors.
Machinery: This parameter tackles the machines and tools needed to produce the output or service delivery. Here, you will need to consider if the current machines can deliver the desired 6M's of production results. Are machines well-managed to get the best of their abilities?
Mother-nature: Are both controllable and unpredictable environmental conditions considered in the process of producing the intended results? In other words, this parameter helps the organization ponder the controllable and random environmental influences in both external and internal factors to their process.
Manpower: Another parameter for 6M's of management is Manpower. This focuses on the people or workforce involved, covering their operational and functional labor. It also checks the personnel's proficiency whether it is up to the standards of the process.
Part 2. The use of 6M in Cause and Effect Analysis
In the 6M method, the analysis focuses on the problem. It explores the possible causes to address them and generate countermeasure operations. This method creates a mnemonic representation of different categories and dimensions to foster brainstorming. Forming a fishbone model, hence, is also known as Fishbone Diagram. It should cover and capture all 6Ms of management mentioned earlier.
After classifying the causes, you should identify all the causes and plan for improvement and development. On the other hand, this model should not plunge you into being indecisive but have clarity with the process.
Part 3: 6Ms Analysis Examples
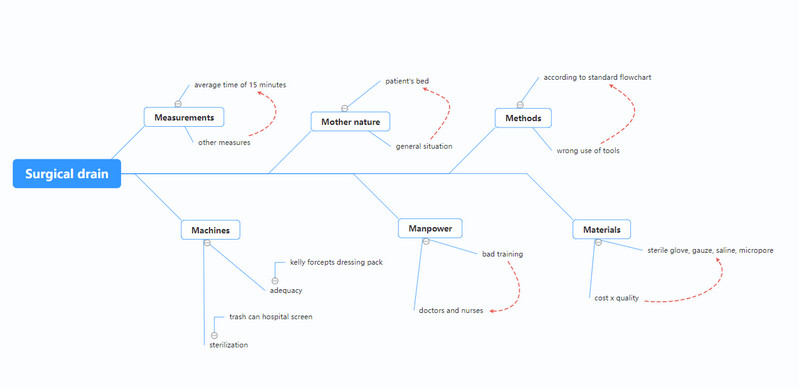
1. Care Instructions with Surgical Drain
This model depicts the cause for a surgical drain, discovering the probable causes when it comes to methods, mother nature, measurements, materials, manpower, and machines.
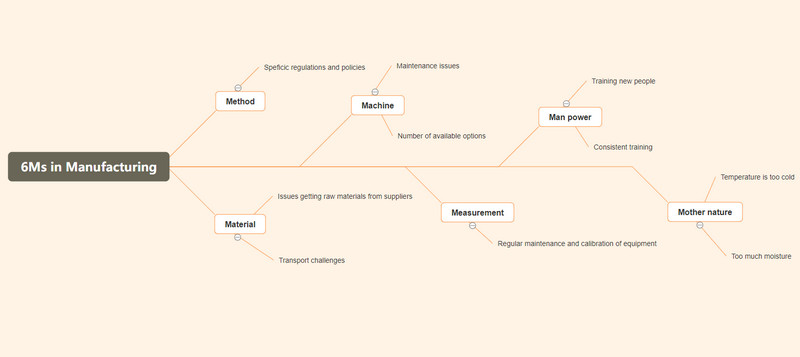
2. Manufacturing Analysis
This subsequent 6M fishbone analysis centers on determining the problem in manufacturing. It considers the 6Ms in management in a thorough manner to solve issues. Also, this model will foster or encourage wholesome operations to address issues.
Part 4. How to Mind Map with 6M Analysis
6M analysis is proven to effectively identify the root cause of a process or a problem. This diagram applies to various fields, including sales and marketing. In fact, you can create this diagram using a suitable program. Suppose you want to learn how you can create your own 6M analysis or fishbone diagram. In this case, you should use one of the best diagram creators available. None other than MindOnMap.
A browser-based mind mapping and diagramming application enables you to generate this mnemonic reputation with minimal effort and high efficiency. This tool provides various editing options for layout, text, branches, shapes, and a lot more. Aside from that, it comes with themes you may apply to your diagram to customize your diagram's appearance easily. Learn how to create 6M fishbone using this diagram creator.
Access the web tool
First off, launch MindOnMap from your web browser. Then, click the Create Online button from the main page. You also can use the desktop version by clicking Free Download below.
Secure Download
Secure Download

Select a layout
Choose a theme from the layout panel and select fishbone from the layouts available. Then, it should redirect you to the editing panel of the tool. Now proceed to make your diagram.

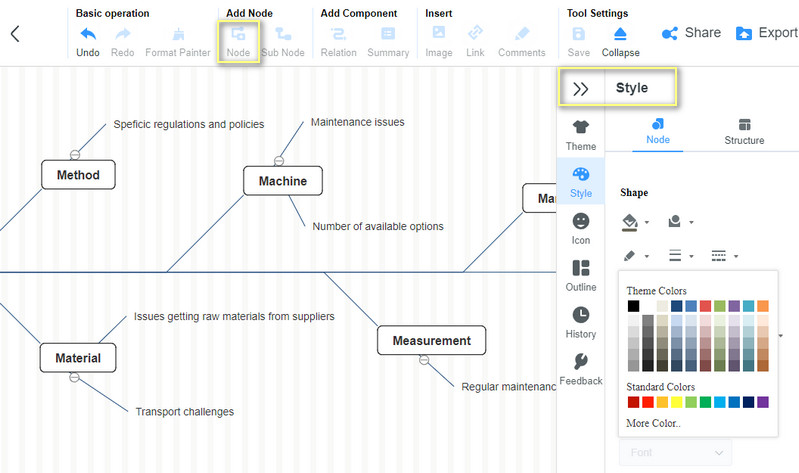
Add branches and edit the diagram
Next, click the Node button at the top menu and add six branches to the diagram. After that, label each node with the 6Ms of management. Insert the necessary information and access the style menu on the right side portion of the interface.
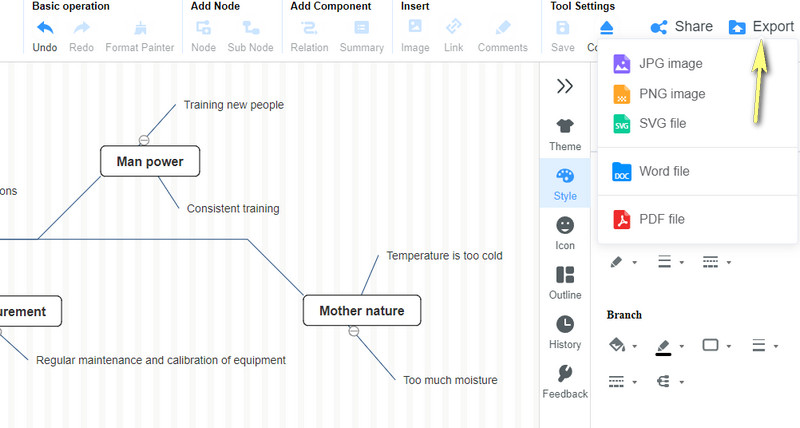
Export the final project
After modifying the project, click on the Export button in the upper right corner and save it in your desired format. You can also share your final output with your colleagues or friends using the project's URL.
Further Reading
Part 5. FAQs on 6M Analysis
What is 4M method analysis?
Like 6M, 4M is also used to point or spot probable causes of product problems. It stands for Man, Machine, Material, and Method.
What is the 5M method root cause?
5M lists five factors affecting the problems in a process. That includes Manpower, Machinery, Measurement, Methods, and Materials. With this analysis, you can identify the inefficiency risks and check if the process is low quality.
What is the use of Ishikawa’s diagram?
This diagram has a close relation to the design problem, service delivery, and production of an organization. It primarily helps show the root cause of a process that goes into the outcome.
Conclusion
You now know the 6M fishbone analysis, its purpose, and how to create one. You can then illustrate a cause and effect diagram to help you solve issues in a process. Moreover, with the help of MindOnMap, you can produce a comprehensive diagram through the substantial symbols and figures it provides. Best of all, you may share your diagrams with others conveniently.