What Is A CPM Chart: Features and How to Create
CPM refers to Critical Path Method. And CPM charts are the graphic tools that highlight the most important process of a project. It is are often needed when you are going to make a plan or process an event. It helps people clarify the relationships of their tasks, so as to improve time management, resource distribution, risk assessment, etc. And this article will explain key features of a CPM chart and how to make it with an excellent tool, MindOnMap.

- Part 1. What Is A CPM Chart
- Part 2. What Is the Difference Between PERT and CPM
- Part 3. How to Create A CPM Chart with MindOnMap
- Part 4. FAQs
Part 1. What Is A CPM Chart
Core Features
A CPM chart, or Critical Path Method chart, is a visual representation that promotes your scheduling with highlights on the critical path. This path refers to the particular sequence of tasks that would take the longest time to finish the project. And it usually includes the most decisive tasks, impacting the whole timeline. Thus, the CPM chart is created to evaluate the time it requires, smoothing the project delivery.
Basic Structure
A CPM schedule is mainly composed of four parts: activities involved, every activity duration, predecessor activities and computations of critical paths. In particular, a predecessor activity is related to those interacting tasks. They often have a dependency on each other. And if you want to deal with a specific task, you must complete its predecessor activities in advance. Besides, the computations include the earliest start time, earliest finish time, latest start time, latest finish time and floats. The above elements will guide you in the plan's execution.
Major Processes
After learning the features and structure of a CPM chart, you can start practicing. Here are the three major stages: information input, data evaluation and recalculation for minimizing time and costs. You will be a qualified planner with good organization of these processes.
Part 2. What Is the Difference Between PERT and CPM
There is another visual tool called PERT charts, or Program Evaluation and Review Technique charts. Similar to CPM charts, PERT charts are also invented to facilitate scheduling. However, their focuses differ from each other, making them essentially two things.
Firstly, PERT puts emphasis on time control, while CPM concerns both time and costs. The former aims to conclude the project duration and the possibility of completing it within a certain time. On the contrary, the latter presents a time-cost trade-off, trying to speed up the process at a low cost.
Secondly, PERT suits new projects without certainty, but CPM targets repetitive schedules. Innovative programs, like scientific studies, are hard to process exactly step by step. Their duration and risks, therefore, become unpredictable. And it is time to use a PERT chart to make a dynamic schedule. In contrast, CPM handles well with fixed activities well, like building constructions.
Thirdly, CPM centers on the key path of a project, while PERT strives to organize the whole project. Thus, CPM can be seen as a component of a larger PERT analysis. You can use a PERT chart for the overall planning, and take a CPM chart as a statistic tool to process settled activities.
To tell their differences clearly, you can see the PERT and CPM chart examples provided here. Both of them start on the left and stretch to the right. These letters stand for your tasks, and the circles are used for filling them in. In addition, the arrows express their orders and the time needed.
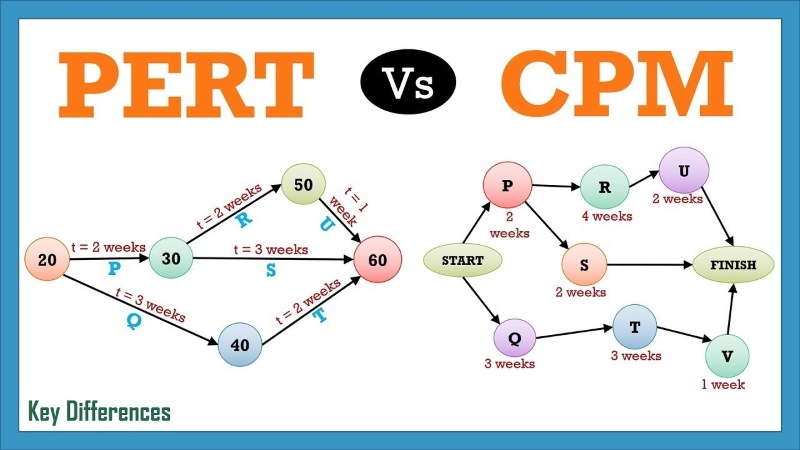
Notice that the preparations of the two are nearly the same. You are required to list all tasks and figure out their interactions. On that basis, you can make further estimates.
Part 3. How to Create A CPM Chart with MindOnMap
MindOnMap is an excellent graphic design software. And it is, of course, a good PERT or CPM chart generator. With a variety of graphics and arrows, it allows you to develop your chart freely, which shows great flexibility. You can create an individualized CPM chart, perfectly meet your needs and show your style. The steps of drawing a CPM chart with MindOnMap are described as the following part.
Go to the MindOnMap website on your browser. Then click Create Online to open the interface of the operation. Also, you can download and use it on your devices.

Enter My Flowchart to get prepared for making a CPM chart.
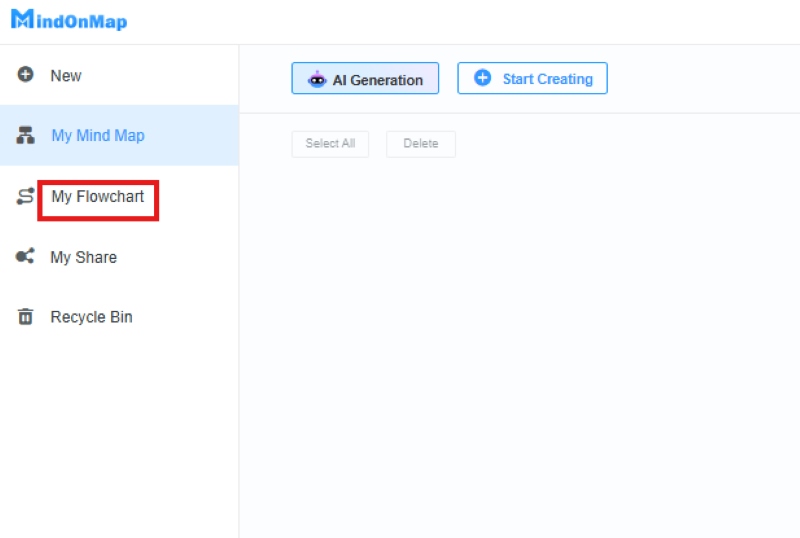
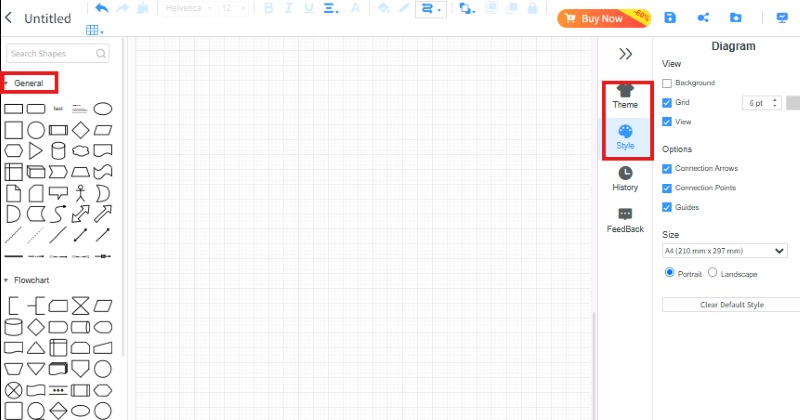
Then you can look through the drawing board. Several shapes are provided on the left of the page. On the other side, you are able to change the theme and style of your canvas.
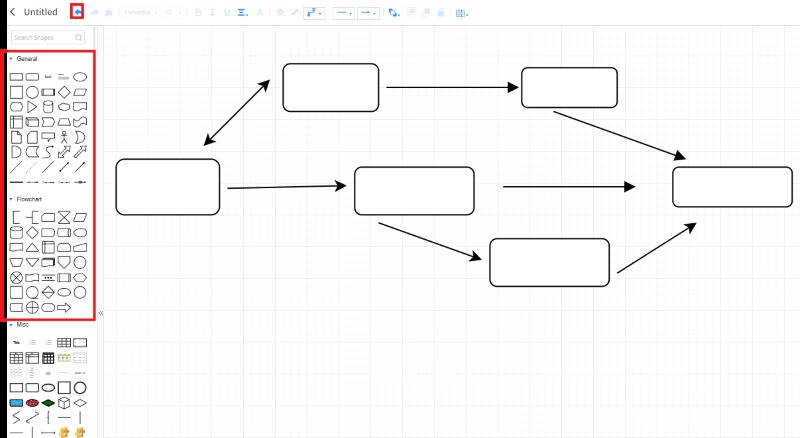
Pick a shape you like and drag it to the canvas. Repeat the operation until the prototype of your CPM chart is formed. If you make any mistake, do not worry, click the undo icon.
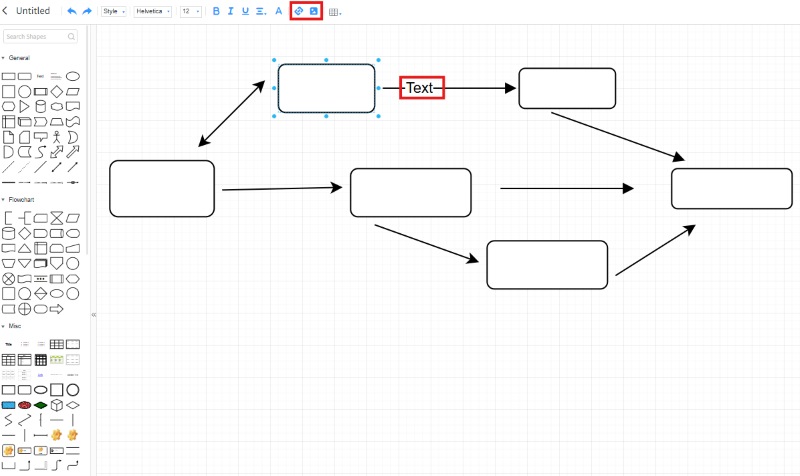
After finishing the framework, you can double-click the blocks and arrows to input your information. You are also allowed to insert images and links here.
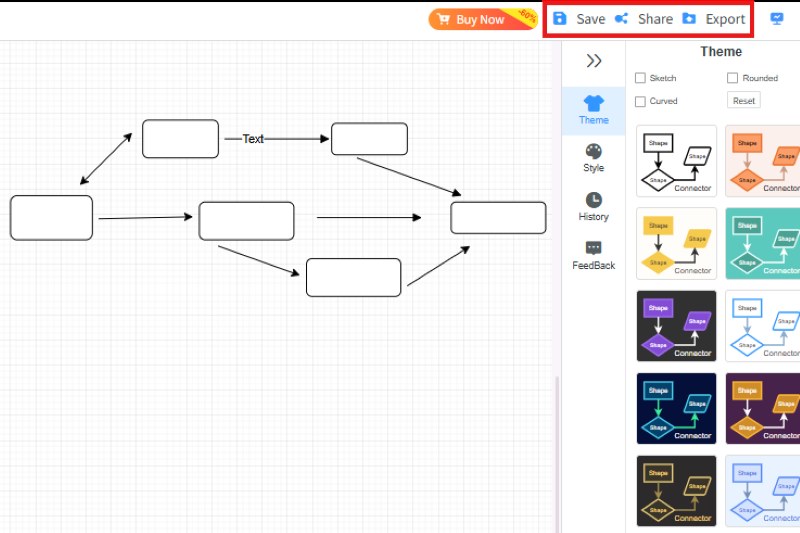
When you finish your CPM chart and are satisfied with the result, download it by clicking Export. Besides, you can share it with others by copying the link.
Part 4. FAQs
What is the difference between Gantt and CPM charts?
Both Gantt and CPM charts are visual tools of project management. However, Gantt charts highlight tasks, dependencies and time limits for a project. CPM charts, on the other hand, focus on the key sequence of tasks, which determines the whole completion time.
How to calculate CPM manually?
To get the duration of the critical path, you are supposed to find the start time of the first task and the end time of the last activity. The difference value is the result you want. If it is not as fast as you expect, you can find the most time-consuming part and try to shorten it, resulting in smoother processing.
Conclusion
In summary, this article defines a CPM chart and explains its distinctions from a PERT chart. For fixed tasks, you can use a CPM chart to evaluate the duration. For changeable scheduling, it is suggested to draw a PERT chart. After learning their major differences, you can pick up MindOnMap to start your graphic design. It will not only enrich your life, but also boost your work performance.