Ultimate PERT Chart Examples and Walkthrough on How to Create Online
PERT or Program Evaluation and Review Technique. It is a visualization tool that helps you keep track of dependencies by gathering the necessary information for a project. The main objective of using this chart is to monitor the time spent on a project specifically. The project management team can organize, schedule, and map out tasks to execute within a project.
This technique has a similar process or concept with a precedence diagram. Once a task is done, another task will initiate. Something has to precede an activity being done. What is more, there are two methods in creating a PERT chart. It can show milestones dates in nodes or represent activities or tasks as arrows. Dive further into this article to learn about PERT chart definition to help you manage your project tasks. Also, free examples are provided, which you can use for your reference.

- Part 1. What is a PERT Chart
- Part 2. PERT Chart vs. Gantt Chart
- Part 3. Free PERT Chart Examples
- Part 4. How to Draw a PERT Chart
- Part 5. FAQs on PERT Chart
Part 1. What is a PERT Chart?
Before making your chart, it is necessary to learn more about the PERT chart and when you will use the chart. As stated, a PERT chart is a technique used to represent the project's tasks solely to track them and estimate the time each activity will take to finish. In essence, you can create a schedule and generate a timeline that you can share with stakeholders, prepared before executing a project.
Furthermore, making a PERT chart can be helpful across different fields. This is suitable for creating a working schedule ideal for project management, educational programs, website creation, software development, and more. Project managers use this chart to evaluate the resources, identify critical paths, and generate a good schedule beneficial for the project. Now, let’s have a further look at the objective of a PERT chart.
1. Estimating time frame
One of the significant advantages of using a PERT chart in project management is it shows the details for the completion time of individual tasks and the entire project. Ultimately, this is to help you identify the activity that takes the longest time to calculate the shortest possible time for completing the project.
2. Evaluating resources
Another valuable benefit of a PERT Chart is evaluating project resources. With it, you can quickly gather the needed resources and omit those that are not necessary. Having the information upfront and accessible allows you to allot more time for the essential resources to complete the project.
3. Visually mapping out the critical path
Identifying the project's critical path is also an excellent benefit for project managers to obtain from using a PERT chart. This is probably one of its key features. It enables you to calculate the estimated time to put up the entire project by getting the average timeline of the project to spend in finishing the project.
Part 2. PERT Chart vs. Gantt Chart
Looking closely at the PERT chart, it has similarities with the Gantt chart. This is an approach to illustrate the activities done against time. Also, it is used to maintain and track project timelines.
In other words, the PERT chart and Gantt chart may have similarities as both compute the time allotted in completing individual tasks and the entire project. However, there is a thin line between these two charts. If you like to learn further about the differences between the two charts, you look into the PERT chart vs. Gantt chart comparison below.
Most people prefer using the PERT chart to Gantt chart because it details important information like work duration, completion time, and obstacles for a comprehensive project evaluation. However, the big benefit of using a Gantt chart is that it is more structured than a PERT chart that adopts different layouts according to the project's requirements.
While PERT charts offer customization, Gantt charts are more into an organization. Simply put, there are no strict standards for creating PERT charts. You can do simple layout customization that fits well with complex and high-level projects. On the other hand, Gantt charts give a structurally organized illustration of a project timeline. This can be one of the significant disadvantages of the PERT chart you might need to deal with.
Part 3. Free PERT Chart Examples
If creating a PERT chart is not your thing, you can refer to the pre-designed PERT chart examples underneath.
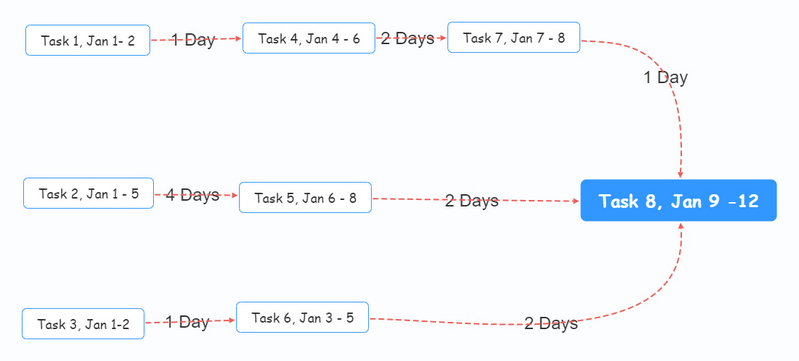
You can use this template to list the project's activities, including the expected start and end date. You may also add the stakeholders necessary to complete the task and how many days the task will be finished.
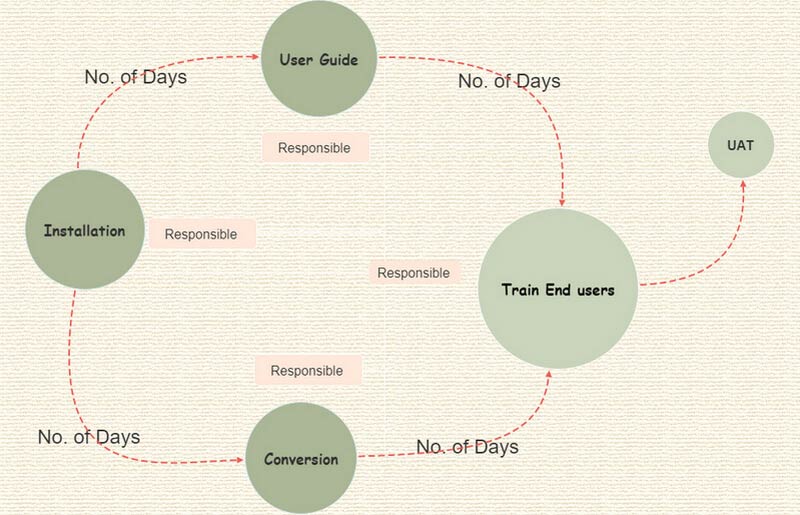
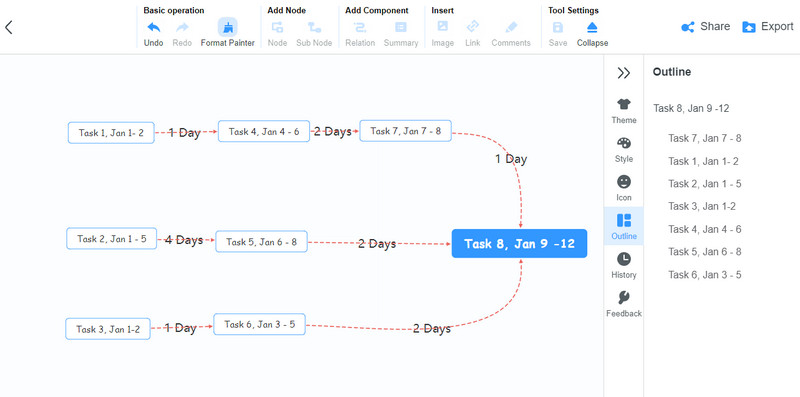
The following PERT chart example template allocates tasks to the responsible person among the team. Each node showcases the task name or the assumed output labeled with completion days.
Part 4. How to Draw a PERT Chart
Drawing this chart by hand is a conventional method. It can be a bothersome task, especially when dealing with a large-scale project. You would use a program that would make the process fast and easy.
One of the recommended PERT chart maker online free tools you should consider using is MindOnMap. The program is infused with various styling tools to change the node shapes into figures. You may also customize the layout, enhance the node color, border, font style, and many more. It also offers a couple of backdrops. You can choose from plain colors and grid texture selections. Best of all, you can quickly edit the nodes that contain the project's information using the outline feature of the tool.
Secure Download
Secure Download
To draw this diagram, you may follow the step-by-step process to use this PERT chart maker and create one online.
Access the PERT chart maker
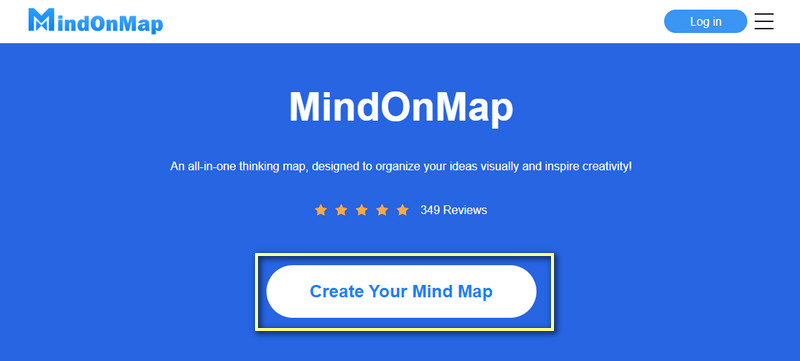
First and foremost, launch MindOnMap using a browser on your computer. Hit the Create Your Mind Map button to open the tool’s interface. You may need to run through the quick registration if you are a first-time user. After that, you can begin drawing your PERT chart.
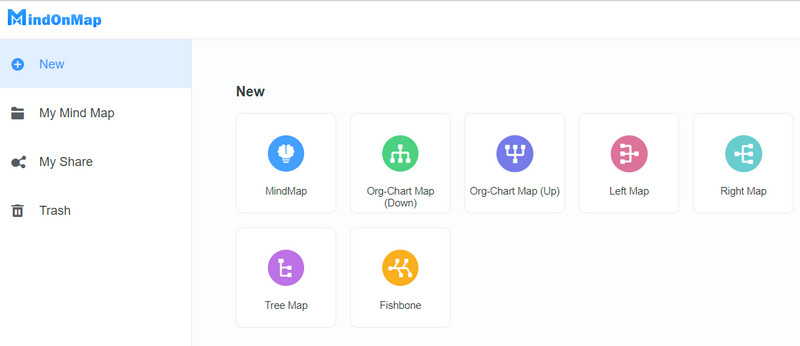
Select a layout
Before reaching the editing panel of the tool, you will need to select a layout or choose from the featured themes on the next panel where you will arrive.
Create and edit the PERT chart
Select the figures and elements you need for your PERT chart when you reach the editing panel. You can find shapes on the right-hand side of the editing panel. You can change the node shapes on the Style tab to portray a PERT chart. After that, open the Outline and edit the information of the node like the task name, expected date, number of days, etc. Then, connect the nodes using the relation line.
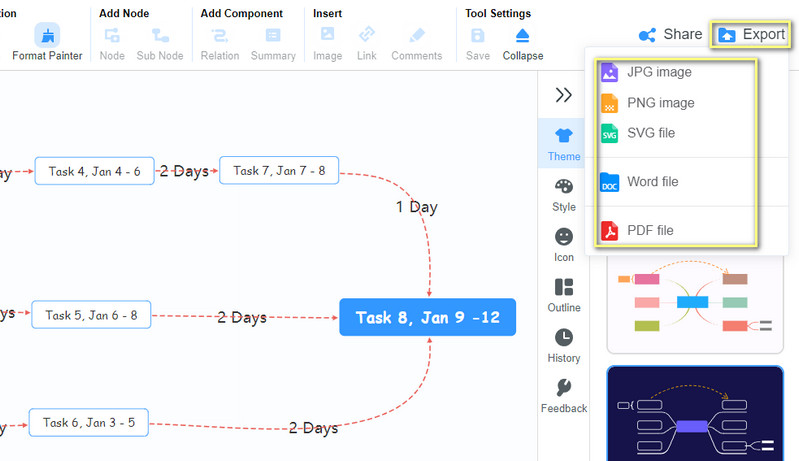
Save the chart
Once you are done editing your PERT chart, save the final version of the diagram. Click on the Export and save the PERT chart to PDF, Word, SVG, and image file. Optionally, you can share it with your friends and colleagues for preview or checking.
Further Reading
Part 5. FAQs on PERT Chart
What is a PERT chart in project management?
A PERT chart is developed to help project managers schedule time for completing the entire project by identifying the aspects like duration of work, time of completion, and problems possibly encountered before launching the project.
How do I create a PERT chart in Excel?
Creating a PERT chart in Excel is possible using the shapes provided in this program. Also, you can use the SmartArt graphic feature to use ready-made layouts.
How to create a PERT chart in Word?
Since Excel and Word come from the same product provider, you can use the shapes and pre-designed SmartArt layouts to construct your own PERT chart. Yet, if you wish to create a PERT chart instantly, MindOnMap is the obvious answer.
How to read a PERT chart?
The nodes represent the tasks to be completed in a project. The arrows show the flow and sequence of the activities in the project. Inside each node or vector comes the number of days and times assigned to complete a particular task.
Conclusion
PERT charts are essential for most project managers handling different projects, explicitly managing time allocated for a particular project. For your convenience, you can use MindOnMap, the best free PERT chart maker available, to quickly draw your first or following PERT chart. The best part is to refer to the template examples if creating a PERT chart is not your cup of tea.