Top 5 Most Striking Fishbone Diagram Makers of 2024
Are you looking for a more creative way to present a scenario or a case? Get rid of those old and straightforward diagrams and start using the fishbone. You may be wondering how to do these graphic designs, and you can lean on this post. With that, take a look at the highly recommended fishbone diagram makers and see which tool will help you lighten your loads.

- Part 1. What is Fishbone Diagram?
- Part 2. Top 5 Most Convenient Fishbone Diagram Makers
- Part 3. How are Fishbone Diagrams are Used?
- Part 4. FAQs About Fishbone Diagram
Part 1. What is Fishbone Diagram
When evaluating cause and effect, the fishbone diagram, which combines brainstorming and a mind map, is commonly used for root cause analysis. Moreover, A fishbone diagram is one visual root cause analysis method that aids this process. To use this method, you can illustrate and organize possible causes of a problem into a usable framework for problem resolution.
Furthermore, a fishbone diagram is where you can solve whatever problem you have. You can use the mind mapping tool to create a simple chart with simple features. In this article, we'll go over the fundamentals of how a fishbone diagram works, as well as some examples of how to use it in your facility.
Part 2. Top 5 Fishbone Diagram Makers
1) MindOnMap
MindOnMap can provide visual interest templates, such as a fishbone diagram, to assist you in maintaining organization or solving a problem. You can choose your strategic initiatives based on your necessities, and you can add characters to your templates to help you understand the complex structure.
Secure Download
Secure Download
Here are the basics of making a fishbone diagram with the best mind mapping tool.
Visit the Page
Before you begin, you must first acquire the program by visiting MindOnMap's official website.

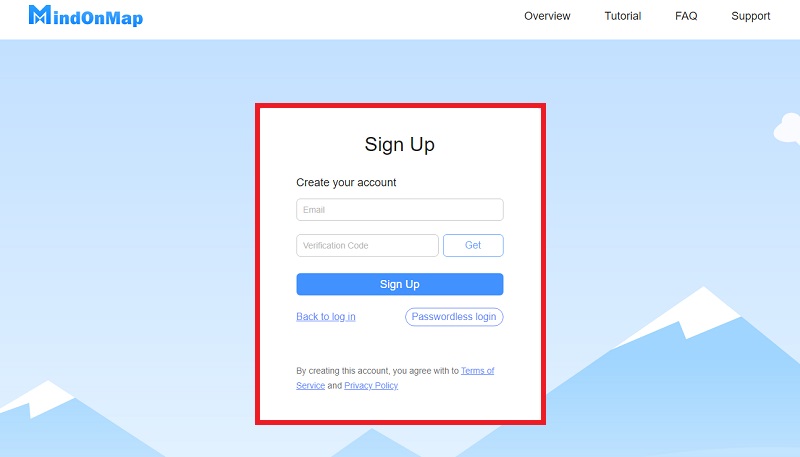
Create an Account
To continue, click "Create your Mind Map" and enter your email address to receive your Verification Code.
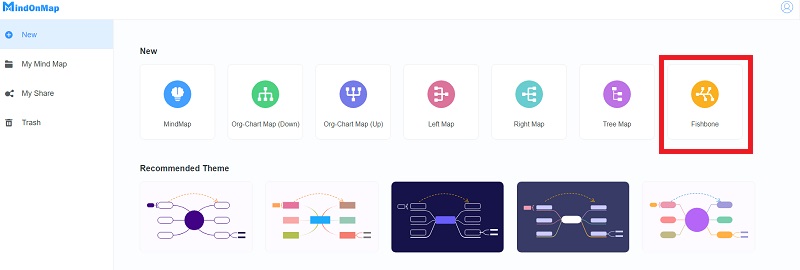
Select the Fishbone Button
After you've created an account, click the fishbone button to begin creating a fishbone diagram.
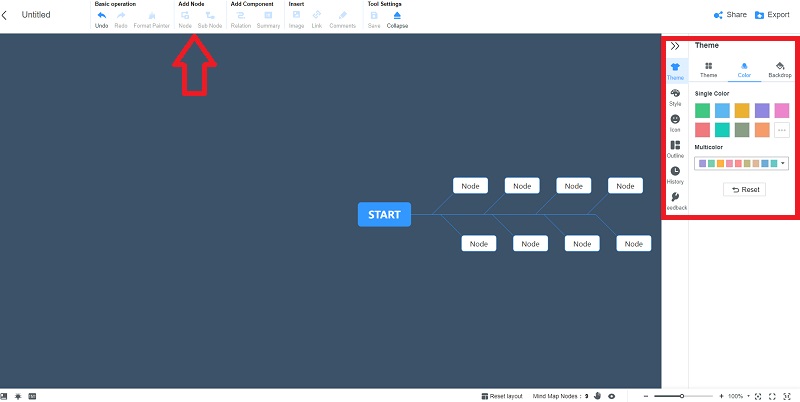
Start with Making the Fishbone Diagram
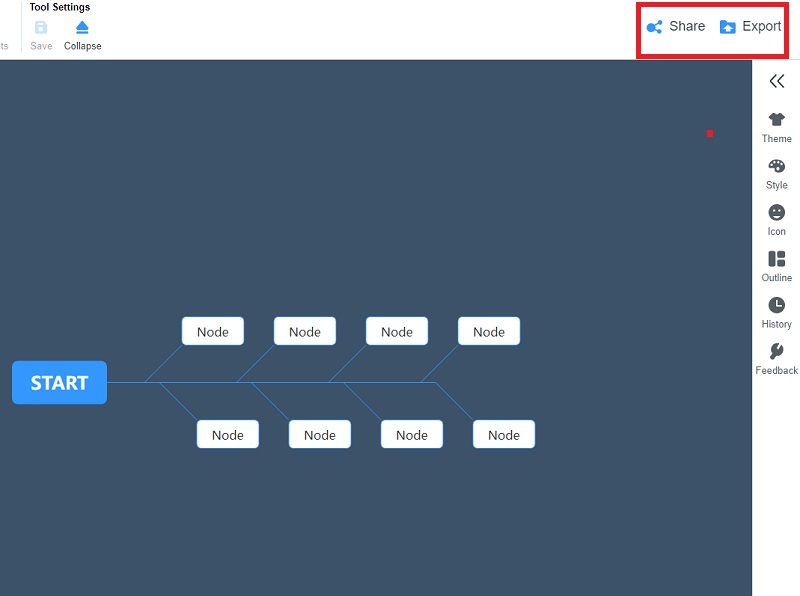
Start creating your fishbone diagram. To make your templates more precise and flexible, click to add nodes and free nodes as needed. Furthermore, choose the recommended themes, styles, and icons you want to use.
Share and Export your Templates
And at last, you can export your templates to images, office documents, PDF, and other formats and share them with others.
2) Microsoft Powerpoint
Microsoft Powerpoint is one of the easy-to-use software when it comes to mind mapping. A fishbone diagram is available to use for creating a template. Allow this software to unleash your creativity. This guide will show you how to create a fishbone diagram template in PowerPoint.
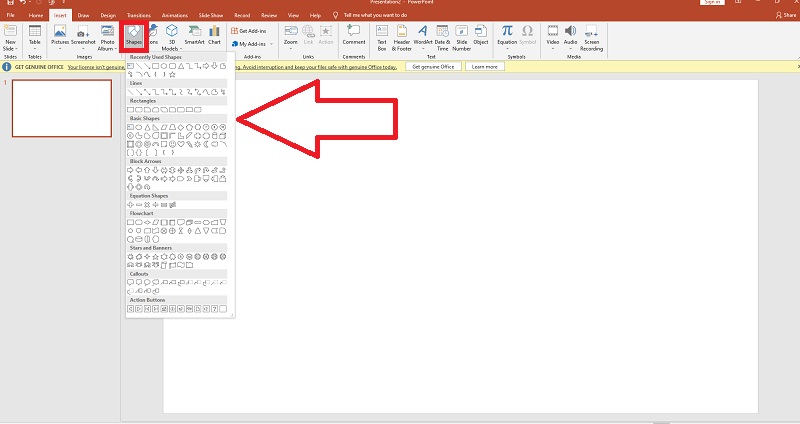
Find the Shape Library
Select a shape or line from the library, then drag your mouse pointer to draw it on your side.
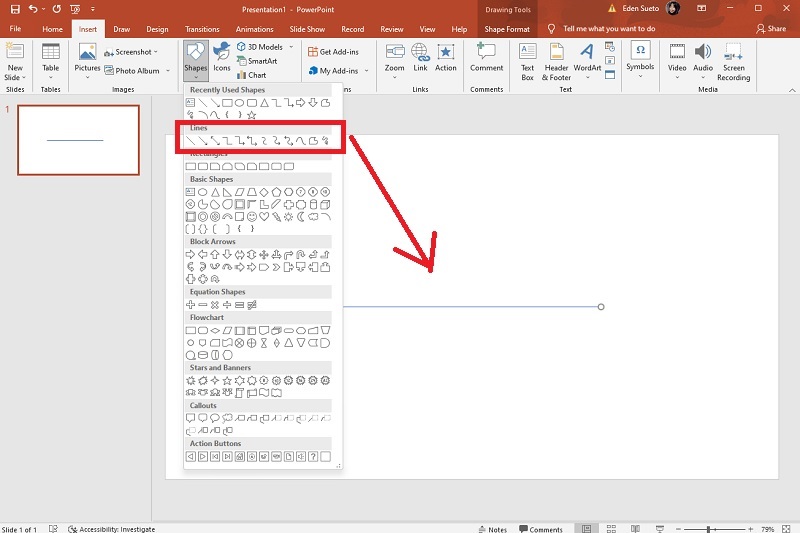
Add any Lines
Browse to the Insert tab and select a shape, then to the Format tab, select Lines from the shape gallery, and add the extra lines to the diagram.
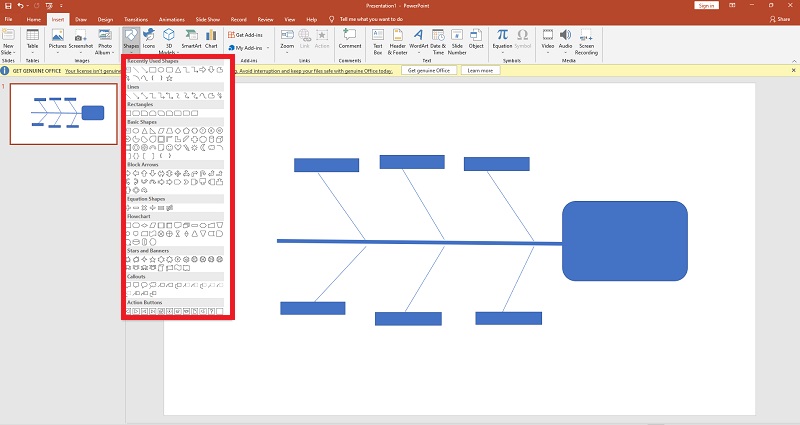
Create your Fishbone Diagram
After you've added lines, begin creating your fishbone diagram and making it presentable.
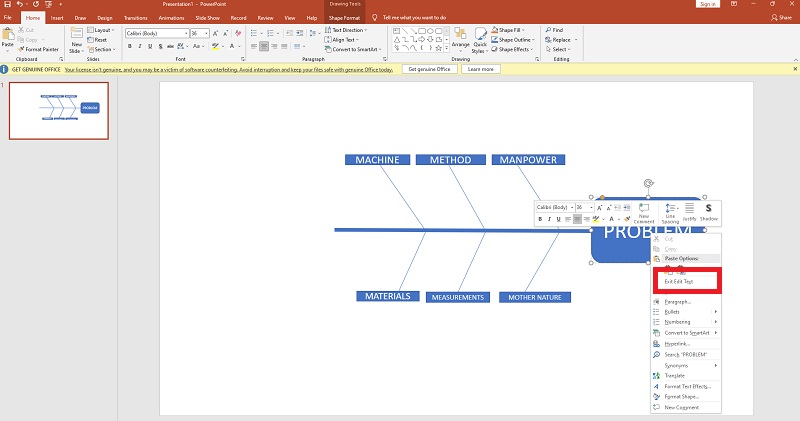
Add Text
It's effortless to add text to arrows and other shapes in PowerPoint—double click and start typing. Do the same thing to edit existing text. The toolbar at the editor's top allows you to easily change the font, text size and color, and much more.
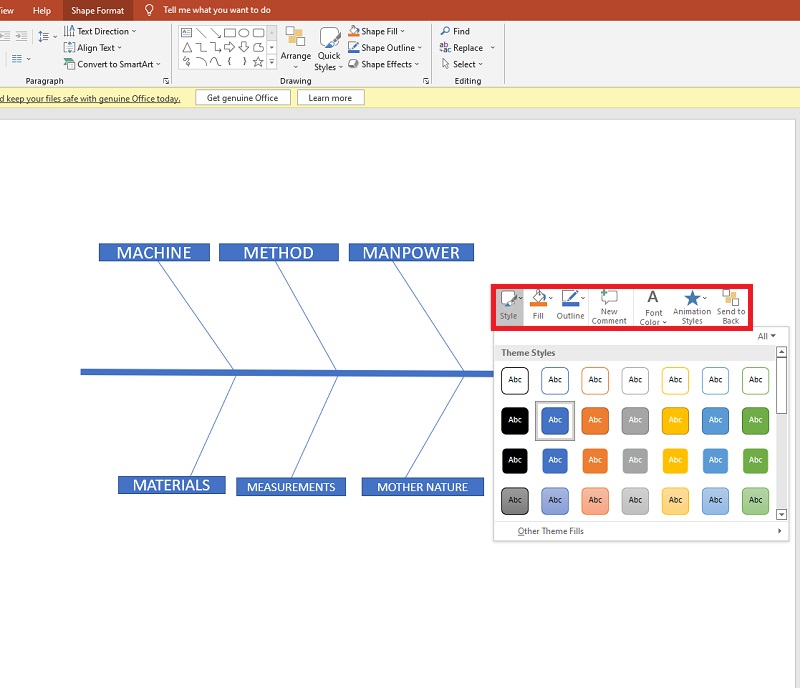
Format and Layout your Diagram
Double-click a shape to change its fill color, opacity, or other stylistic aspects. This will bring up the shape formatting section. Hold Shift as you press on shapes to choose multiples to be edited. Modify the visual elements of your diagram until you're happy with the way it looks. When you're finished, you can save your completed fishbone diagram.
3) Microsoft Excel
Fishbone diagrams describe all of the problems and causes that could impact the system or your work. Generally, the effect is a problem; causes are recorded and resolved to assist enterprise managers in trying to prevent the problem. Because it is shaped like a fishbone, this fishbone diagram excel is one.
This tutorial will show you how to create a fishbone diagram in Excel.
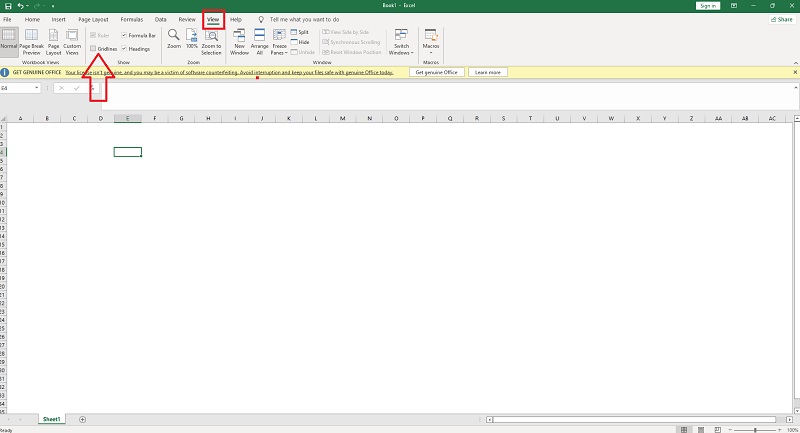
Remove Gridlines
Before you start making the fishbone structure in the worksheet, it is preferred to convert it to a completely blank drawing document so that the grid does not hinder the view. Tap the View tab, then the Gridlines option, and uncheck the box to turn the entire worksheet into a blank drawing page.
Add your Desired Shapes
There is no constructed fishbone diagram template in Excel, so you must create your desired diagram in Excel by adding your preferred shapes.
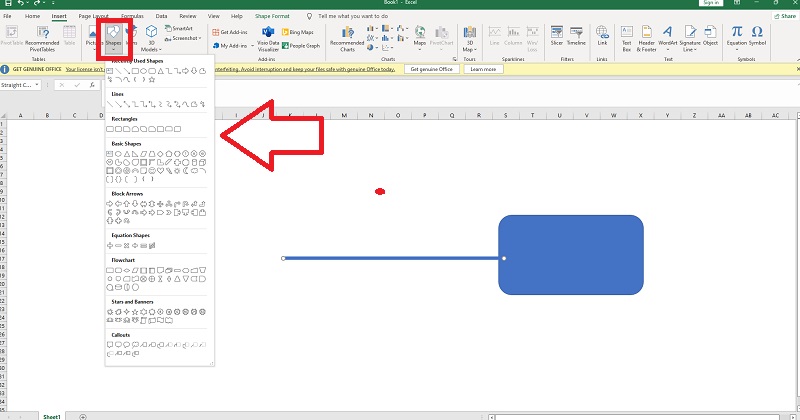
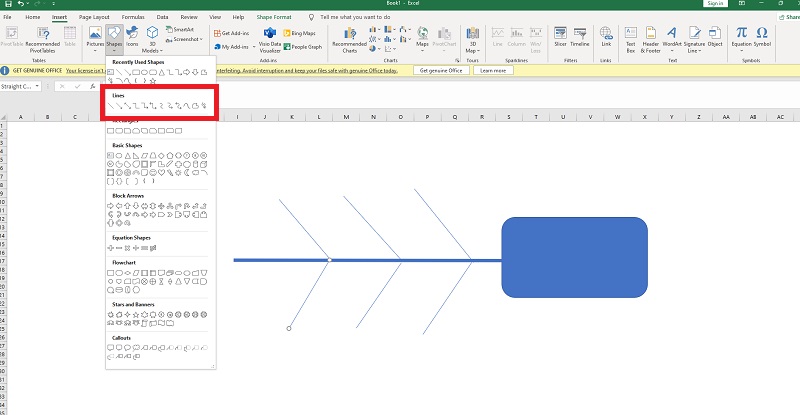
Add any Lines
Go to the Insert tab and choose a shape, then to the Format tab, where you can select Lines from the shape gallery and insert lines into the diagram. The overall design of the fishbone diagram will be outlined after attaching lines.
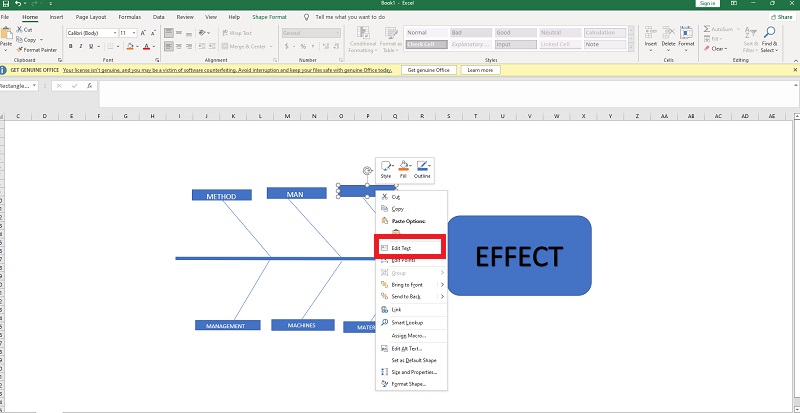
Add Text
To add text to the boxes, click the shapes or right-click, select Edit Text, and type directly on the boxes.
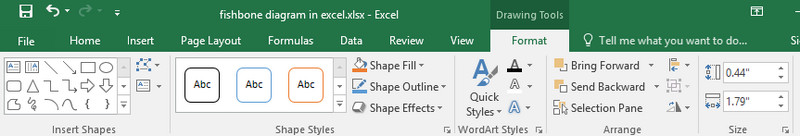
Format your Diagram
Most users want to personalize the fishbone diagrams and adjust visual effects by changing the shapes and text styles, fonts, placement, etc. You can modify the shape styles in the Format tab and the font styles and alignment in the Home tab.
4) Lucidchart
The following are the main steps for creating a fishbone diagram in Lucidchart.
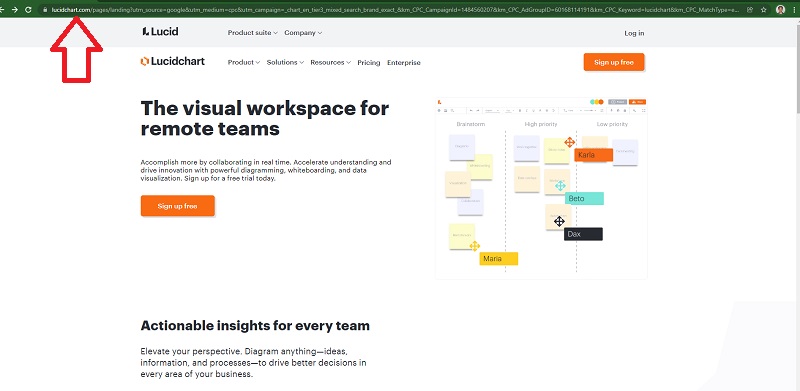
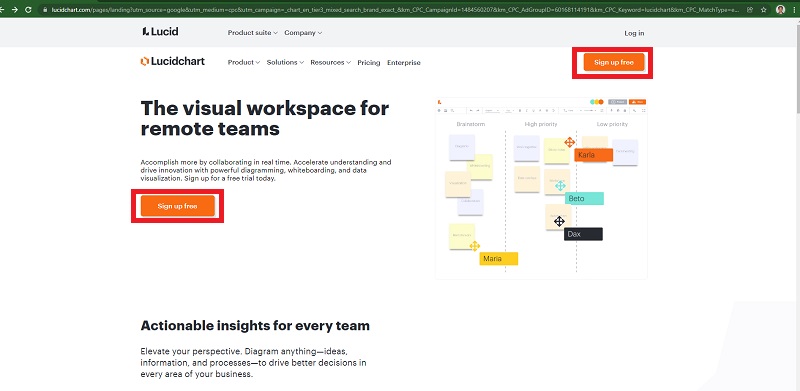
Visit the Web
You can browse the program by going to Lucidchart's official website. If you prefer a faster method, click on the link below.
Create a Lucidchart account
To begin, Register or sign up with your Gmail account.
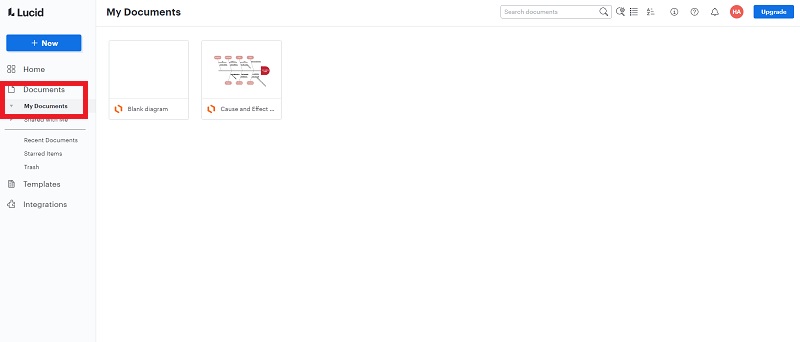
Select My Documents from the menu
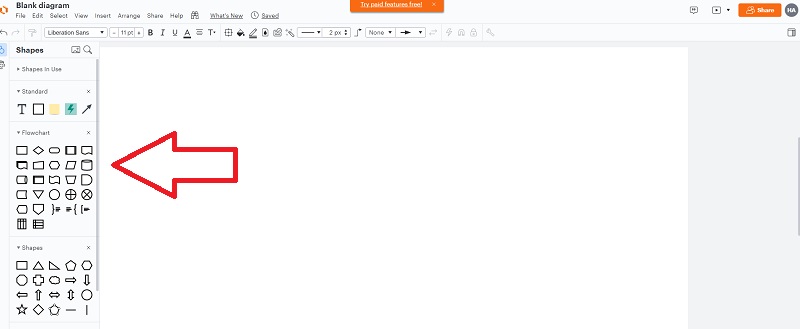
Explore and Proceed with your Template
Begin creating your template. Make use of lines, shapes, and text. Make a fishbone diagram with the menu and other elements.
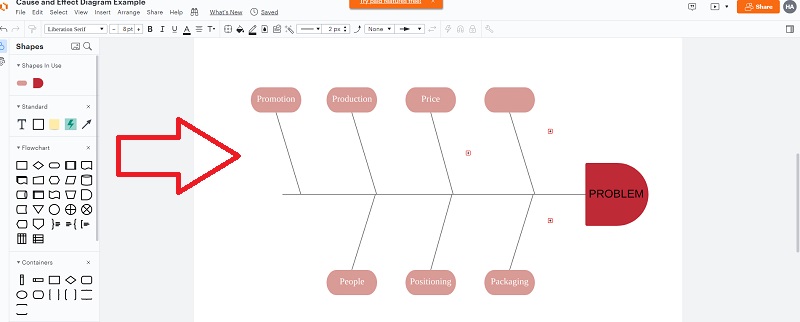
Examine your work
It's time to examine the template after you've finished it. Check that your text is free of errors and large enough to read.
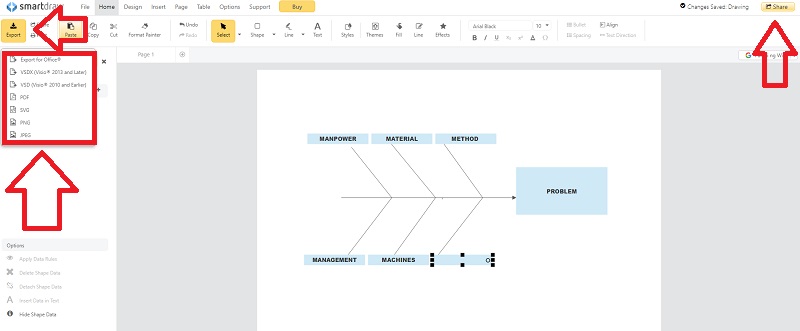
5) SmartDraw
SmartDraw software is valuable and straightforward to use when creating a fishbone diagram. This fishbone diagram maker provides numerous options for selecting a theme, colors, etc. The following are some common steps for creating a fishbone diagram in SmartDraw.
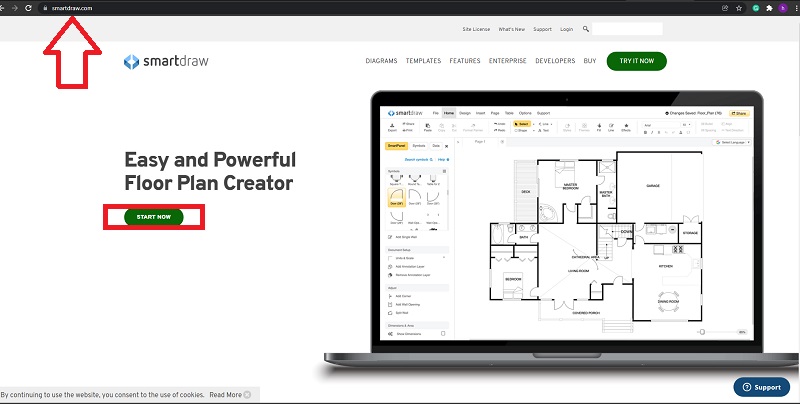
Visit the Web
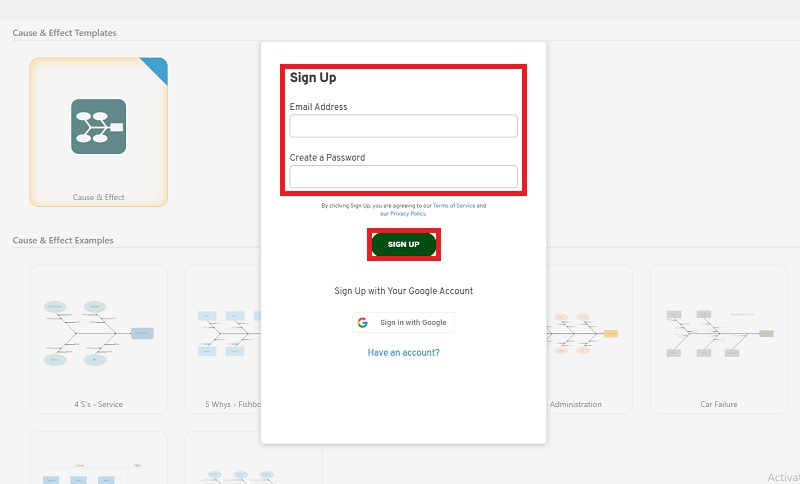
Create a SmartDraw Account
To get started, sign up with your Gmail account.
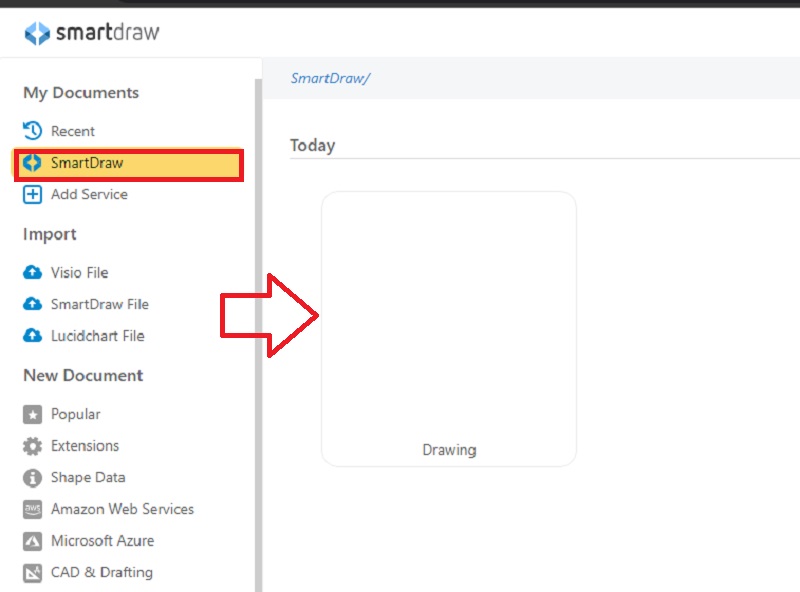
Click the SmartDraw button
Start by selecting the "SmartDraw" button, drawing your fishbone, and making it presentable.
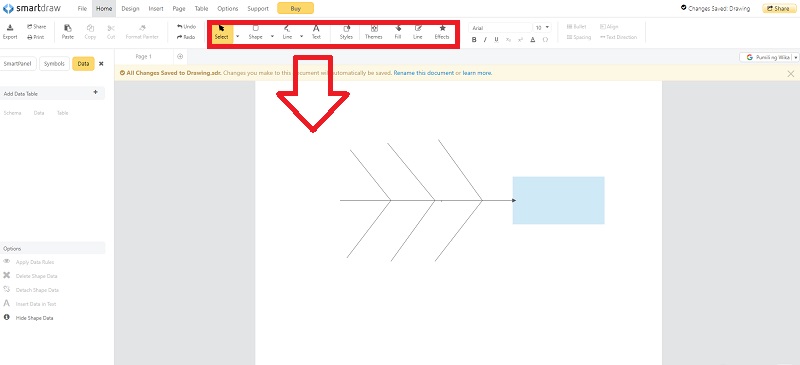
Make your Fishbone Diagram
Start by making a template. Use lines, shapes, and text to your advantage. Create a fishbone diagram with the menu and other components.
Share and Export your Templates
The fishbone diagram template can be shared and exported to images, Word documents, PDF files, and other formats.
Part 3. How to Use the Fishbone Diagram?
In addition, A cause-and-effect fishbone diagram is a critical tool for root cause analysis that can be applied to almost any business area, including project management, process improvement, marketing, and so on.
How to Make a Fishbone Diagram:
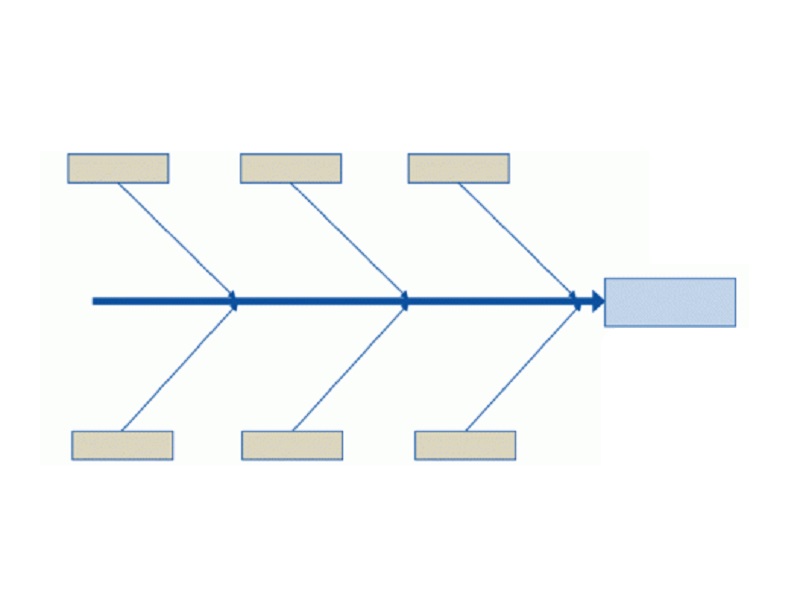
Step 1. Draw the right head, including the problem (effect or issue) for analysis.
Step 2. Draw a straight line from the top of the head to the left. This is the essence.
Step 3. Identify the areas to be analyzed, broad level categories, and branch them from the backbone.
Step 4. Analyze the causes that contribute to the effect from these categories. Connect these causes to the appropriate category branches.
Step 5. Break down the causes into sub-causes until you can't go any further.
Fishbone Diagram Examples:
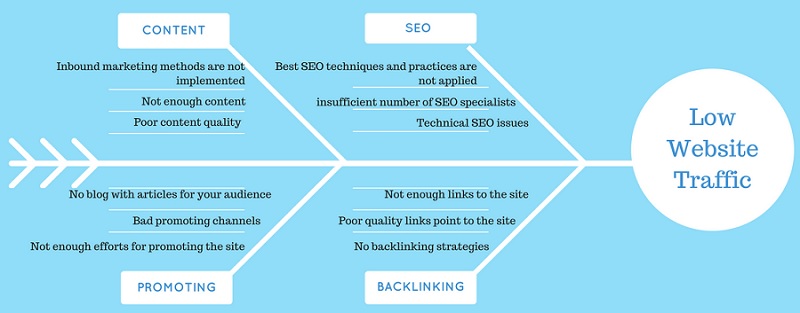
1. Marketing
Assume you are an online marketing specialist working for a company that has low website traffic. You are tasked with determining the primary causes. Here's an example of a fishbone diagram that might help you solve the problem:
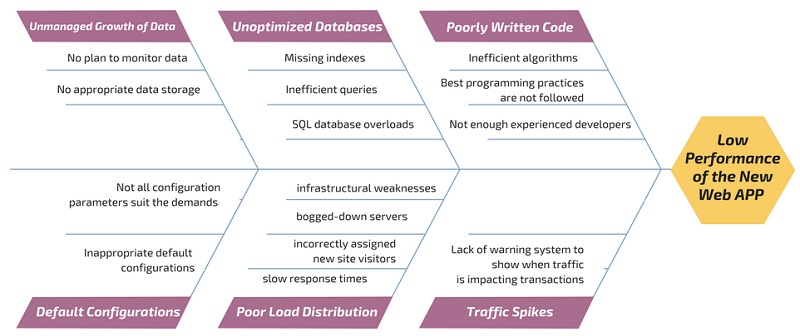
2. Sales Process
A software development company's new web application product performs deficiently. Let's use a fishbone diagram to visualize the possible causes:
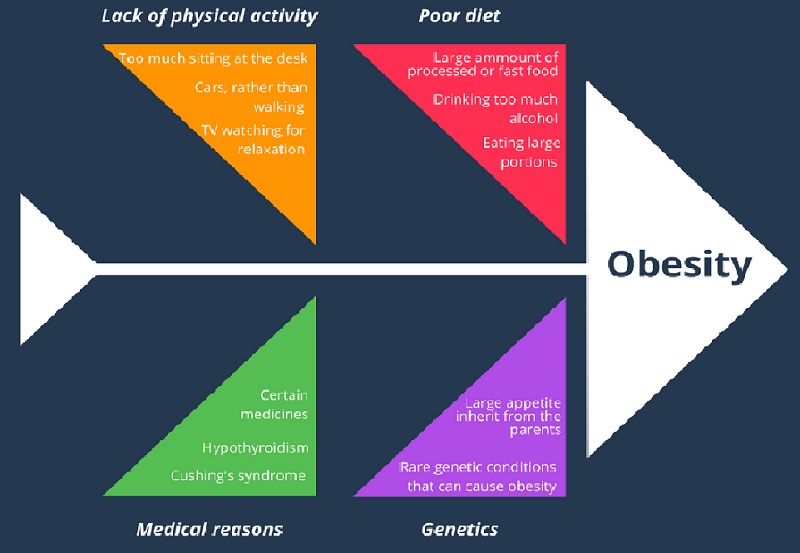
3. Healthcare
Consider an example from our personal and healthy lives. The fishbone diagram healthcare below depicts some of the most common causes of human obesity.
Part 4. FAQs About Fishbone Diagram
How to do a fishbone diagram?
First, you must define the problem statement and identify the major categories of the problem's causes. Furthermore, brainstorm all possible causes of the problem and research each one.
When is it possible to draw a fishbone diagram?
When you want to demonstrate and organize various ideas about the root causes of a problem. When you want to know how different factors contribute to a problem.
What exactly is a template for a fishbone diagram?
The Fishbone Diagram template, also known as an Ishikawa Diagram template, can be used to investigate the potential causes of a problem, allowing your team to find a more effective solution. After you've generated some ideas, sort them into groups to zero in on the root cause of the problem.
Conclusion
To conclude, when faced with resolving a problem, a fishbone diagram is an excellent place to start. However, MindOnMap is a great mind mapping application for creating a fishbone diagram. It is simple to prepare and requires little effort.