What is Mapping System and Its Types [Definition and Step-by-Step]
Maybe you have heard of system mapping, you realized you should be doing it, or you are already doing it. It is a technique that system thinkers utilize to understand systems at play. This map is beneficial for different fields, including education, politics, healthcare, finance, and other organizations.
Every team member must be aware that the system works to maximize the program's effectiveness. This is to identify knowledge gaps, communicate understanding, and further explore the system. In this way, members involved will build a shared overall system model with intervention points and insights. Read on to learn about the system map, its types, and how to create one yourself.

- Part 1. What is a System Map
- Part 2. Types of a System Map
- Part 3. How to Create a System Map
- Part 4. FAQs on System Map
Part 1. What is a System Map
Generally speaking, a system map is a graphical representation of a system. It shows the underlying interrelationships and structure of an organization or a system. Furthermore, this map is designed to create a simplified understanding of a complex system to get everybody involved on the same page.
Typically, when asked about an organization’s system, concerned personnel will tell about the system's elements without knowing how it works. Therefore, it is imperative to the system’s whole process. You can do this with the help of mapping a system. On the other hand, there are different types of this map—each with a unique purpose and benefits. After learning about the mapping system definition, the following section will introduce different system mapping templates and types.
Part 2. Types of a System Map
There are different ways to map a system hence the various types of a system map. Using these maps as system mapping tools, you can identify the divergent parts and find the areas of development to gain clarity in complexity. That said, here are the types of system maps.
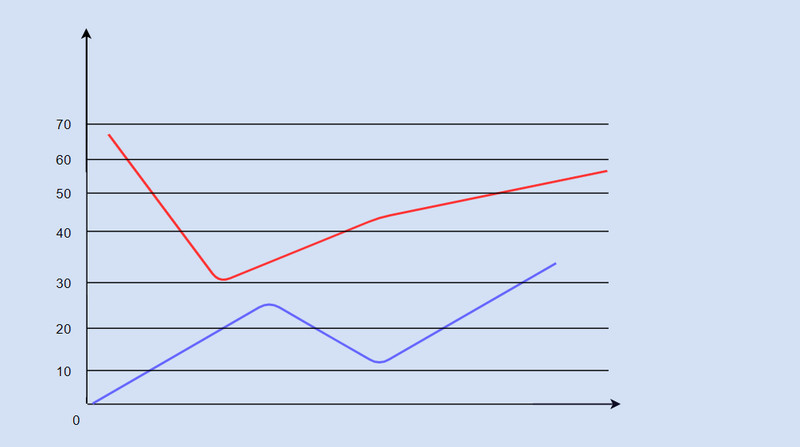
Behavior Over Time Graphs
This type of system map monitors the changing behavior of key variables in your system from the title itself. This map encourages dynamic thinking with a focus on behavior change over time. It typically consists of a horizontal and vertical axis to understand the graph's interrelationships driving through the system's behavior.
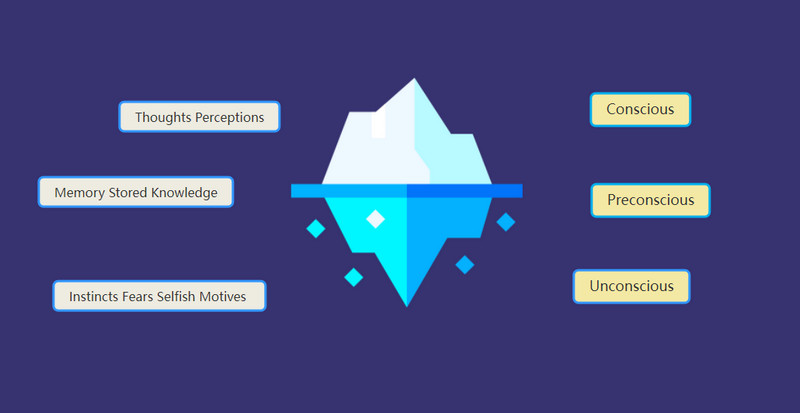
Iceberg Model
If you consider broadening your perspective, an Iceberg model type of system map is suitable for you. This graph applies the concept of 90/10. As we know, 10 percent of the iceberg’s total mass is above water, while the remaining 90 percent is underwater. Moreover, it consists of 4 levels of thinking, including event level, pattern level, structure level, and mental level. Each level targets different aspects of the system. Putting these levels together helps you identify the problem in a system and not look at one facet of the system.
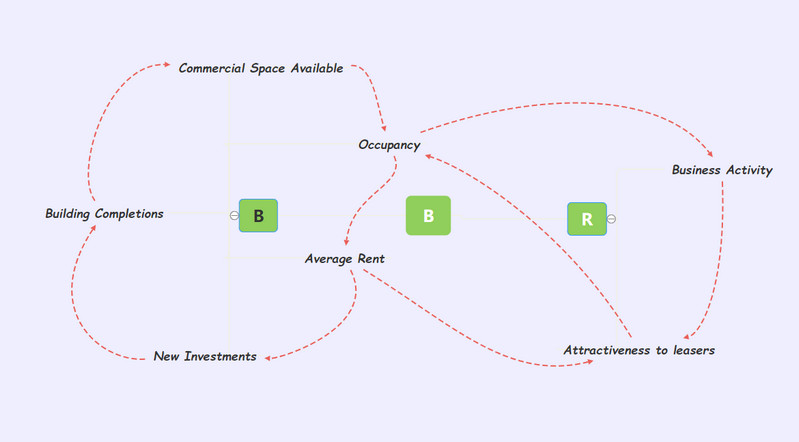
Causal Loop Diagrams
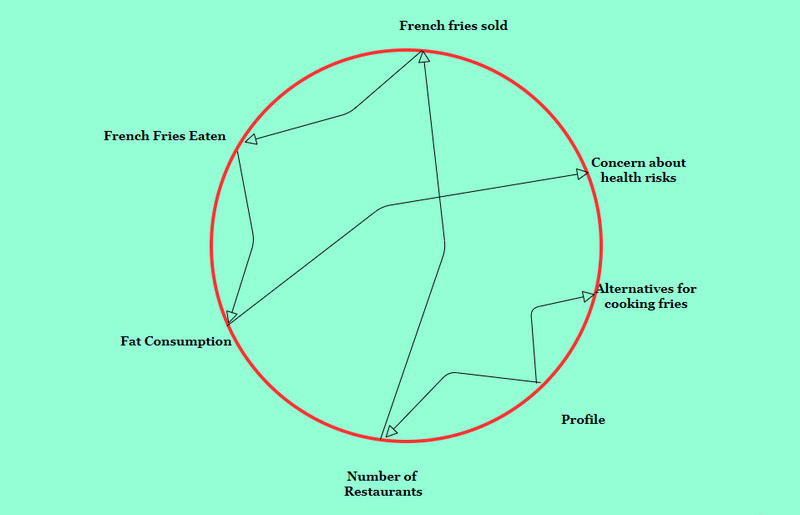
A causal loop diagram is one of the system mapping tools to make stories of complex issues. It consists of variables, links, signs of the links, and loop signs. This diagram helps you make a concise story about a complex issue by putting the several loops together.
Connected Circles
Likewise, connected circles are a technique designed to determine and clarify the underlying causes of complex issues in a system or organization. Furthermore, this map is to heighten the learner’s awareness of the cause of problems that have been taking place. In other words, it helps you brainstorm about the changes and trace webs of causal relationships in the system.
Part 3. How to Create a System Map
Indeed a system map can be done using a conventional approach. When we say conventional, we mean pen and paper. However, things are more straightforward and better when using a digital approach to accomplishing tasks like system map creation. One of the classic and recommended tools to make system maps, mind maps, diagrams, concept maps, and more visual representations is MindOnMap. The tool comes with innovative functions to generate a stylish and comprehensive illustration. It can even work as a cluster mapping software to produce a cluster of ideas and thoughts.
It lets you attach text, images, and links and adjust their properties. Furthermore, you can modify the layout of your maps according to your requirements. On top of that, it works flawlessly across various browsers such as Chrome, Edge, Safari, Firefox, etc. Best of all, this map lets you export your project to a variety of document and image formats. Without further discussion, here are the steps on how to create a system map using this program.
Secure Download
Secure Download
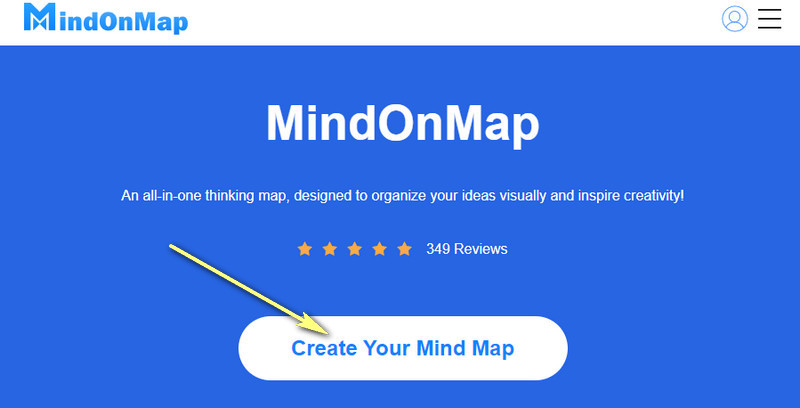
Visit the web application
Launch the tool from your browser and click the Create Your Mind Map. First-time users will need to undergo a quick registration process. After that, you can work on your system map with free access to all its features.
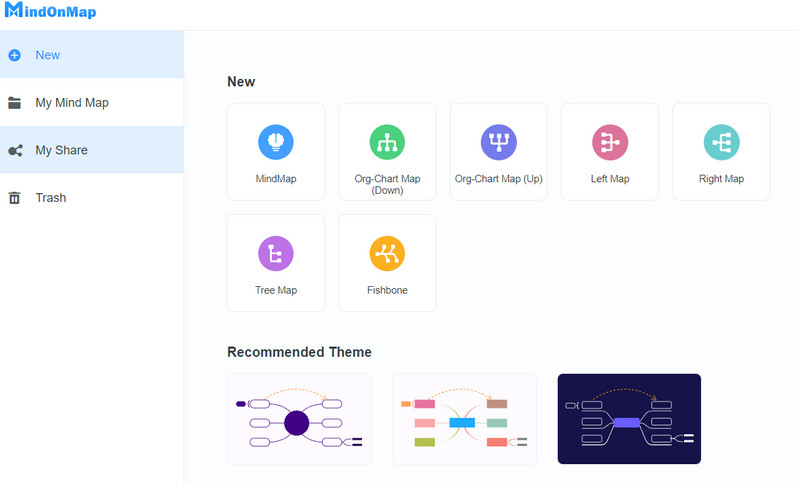
Start creating a system map
You will then reach the template interface to start from scratch or choose a theme suitable for your system map. Now, add the required number of branches for your system map by clicking the Node option at the top menu. Then, insert the necessary information by editing each node.
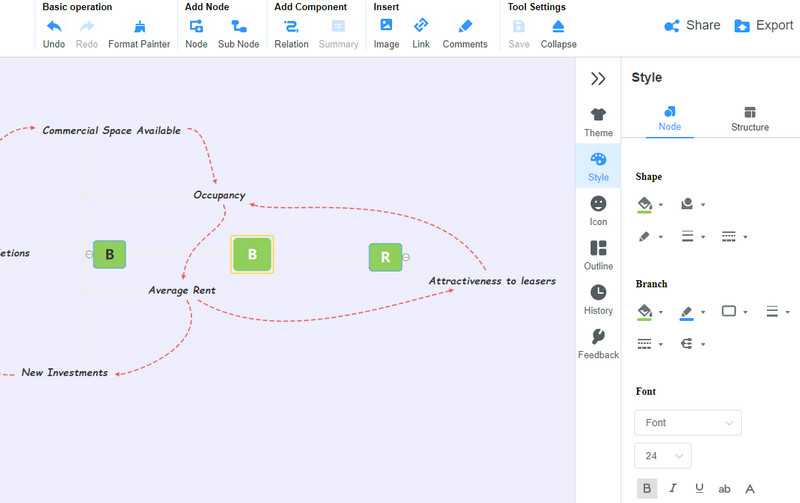
Edit the system map
This time, adjust the placement of the nodes to portray a system map. From the right-hand panel, edit the tool's appearance by changing the font and node styles. You can use different colors, layouts and even change the backdrop of the system map.
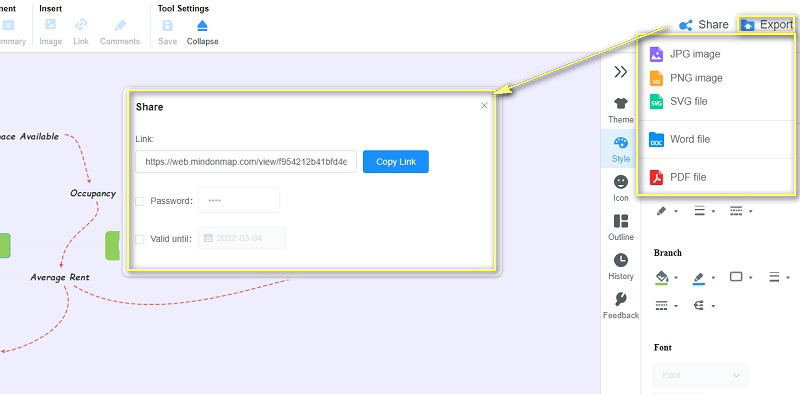
Save the finished system map
To save your output, click the Export button at the top right corner and save it as a document or image file. Alternatively, you may share your work with others by clicking the Share button and giving the link.
Further Reading
Part 4. FAQs on System Map
What information usually a system map can generate?
With the help of a system map, you can generate information such as relationships, feedback loops, actors, and trends to help you understand the system. Also, this is where the underlying problem of a system can be generated, allowing you to address the issues.
Where can I make a system map?
You can create a system map using any mapping software like MindOnMap. With it, you can make any diagram or graphic representation of a system, process, or organization.
What are systems thinking?
Systems thinking tackles and investigates the overall factors and interactions that cause a possible outcome. This is especially helpful in heightening the team’s team’s awareness to learn how they can interact.
Conclusion
If you want to learn about your system and communicate understanding to get people on the same page, a system map is a great way to handle this. Additionally, it helps you address the issues in a system as this map can pinpoint problems using the different types of a system map. Moreover, we provided a tool MindOnMap that could help you easily create this map with innovative functions to style your maps.