How Do I Create a PERT Chart Efficiently and Easily [Problem SOLVED]
A PERT chart is the abbreviation for Program Evaluation and Review Technique. As its name suggests, it is a paradigm that depicts a program's review and evaluation technique. This means with this chart, you would be able to monitor by looking at the track of information gathered for a specific project. Furthermore, through this illustration, you and your team would be able to map out additional tasks to work on and, at the same time, schedule and organize them within your project. Furthermore, as there are various ways to make this chart, many have raised their curiosity about how to draw PERT charts. For this reason, we have created this article to provide you with the solution you need as you continue to read the content below.

- Part 1. Easiest Way to Build a PERT Chart Online
- Part 2. How to Create a PERT Chart in Excel
- Part 3. How to Make a PERT Chart in Microsoft Word
- Part 4. FAQs about PERT Chart Making
Part 1. Easiest Way to Build a PERT Chart Online
Building a PERT chart has never been easy until you meet MindOnMap. It is an online mind-mapping tool that offers full-blast features for free. With its features, you can draw a PERT chart in an artistic and witty way. You can do it by applying lively colors, themes, icons, and fonts while articulating the PERT with images and connection displays to make it look creative. On the other hand, if you want your chart to appear professional, there are also available options to carry out, such as its link, summary, comments, and relation ribbons.
Furthermore, we cannot slip this review without mentioning its advanced features like the collaboration, hotkeys, and flowchart maker. These possessions of MindOnMap can really be a great help, especially when dealing with a more extensive project. Thus, to create this chart easily, you can rely on the process we introduce below.
Secure Download
Secure Download
How to Construct a PERT Chart with MindOnMap
Let’s start by accessing the chart maker on your browser. Then, click the Create Your Mind Map button at the center of the page and proceed to sign up since you are a first-time user. Signing up will only take seconds of your time, for you can use your email account to log in.

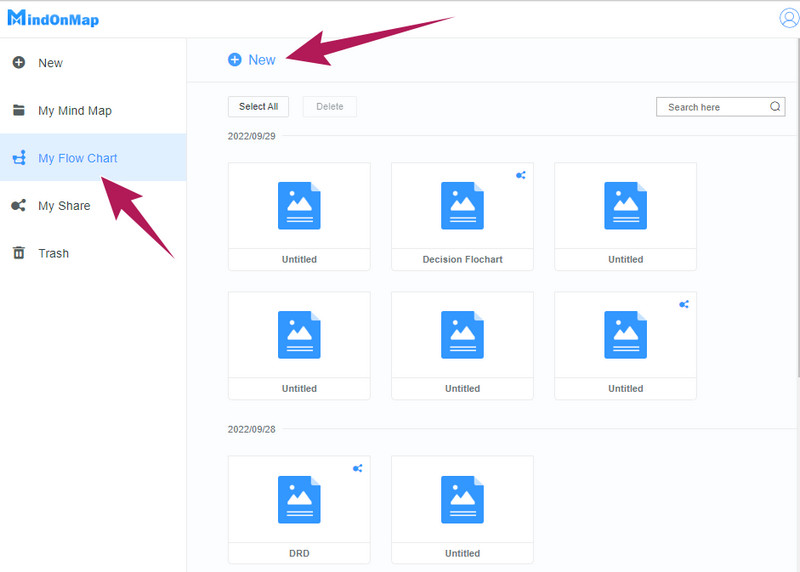
Now let’s proceed with constructing the chart. Go to the My flow Chart option and hit the New dialog that will bring you to the main canvas.
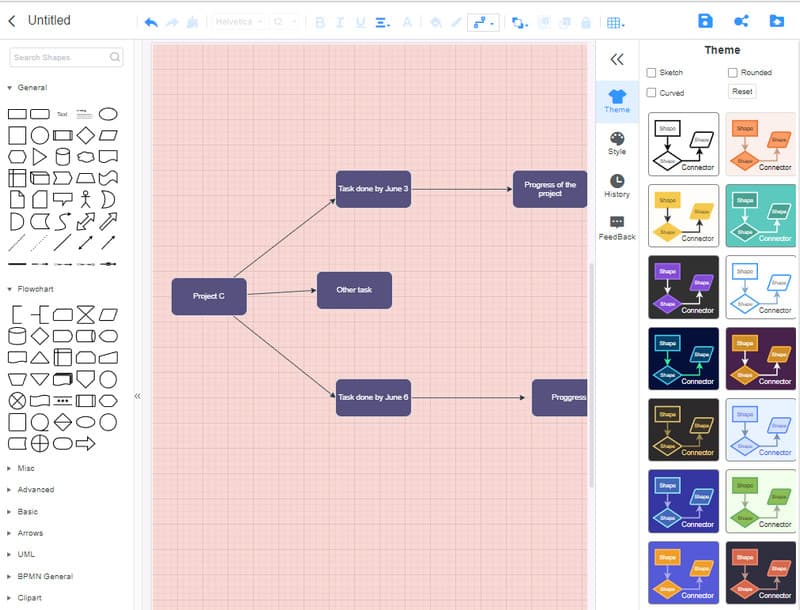
Upon reaching the canvas, you can start building the PERT. Navigate on the stencils on the left for the numerous selections of shapes and elements and on the right for the themes and styles that you can use on your PERT.
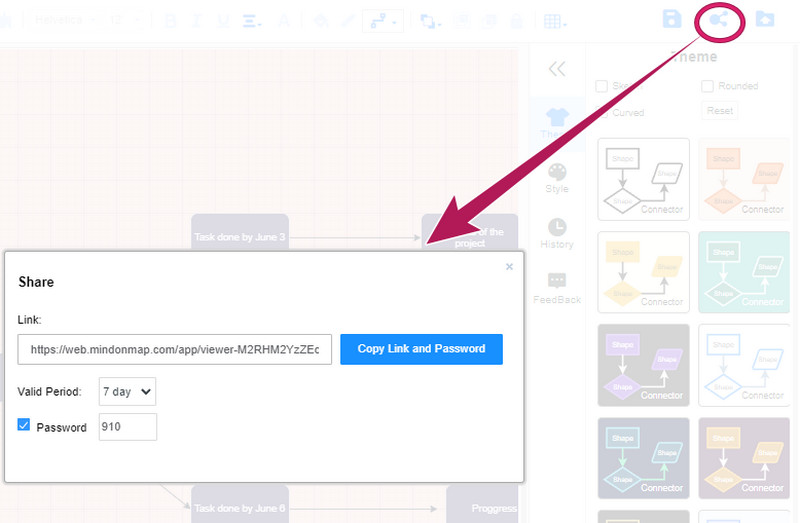
Once you’re done drawing the PERT chart and want to share it with your peers for collaboration, you can hit the Share button. Then, on the popped-up window, toggle the Password and the validity to make them visible. After that, click the Copy Link and Password tab, and send the link to your friends to open.
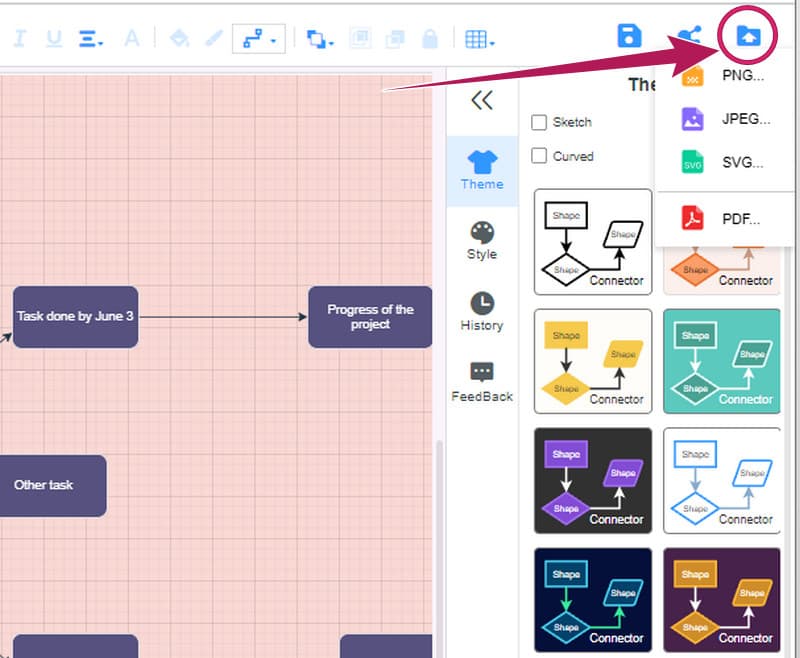
Consequently, you can hit the Export button and choose an output format to download the PERT on your device.
Part 2. How to Create a PERT Chart in Excel
Creating a Pert chart in Excel can be done in many ways. You can use this MS suit by using the default way, the SmartArt feature, and its Text tool. Yes, you can create a chart using the Excel Text tool, which we will discuss using the steps on how to do a PERT chart in Excel below.
Launch the PERT chart maker on your desktop. Note that we will use the 2019 version of MS Excel in this procedure. Once you have opened the Excel, start with a blank sheet.
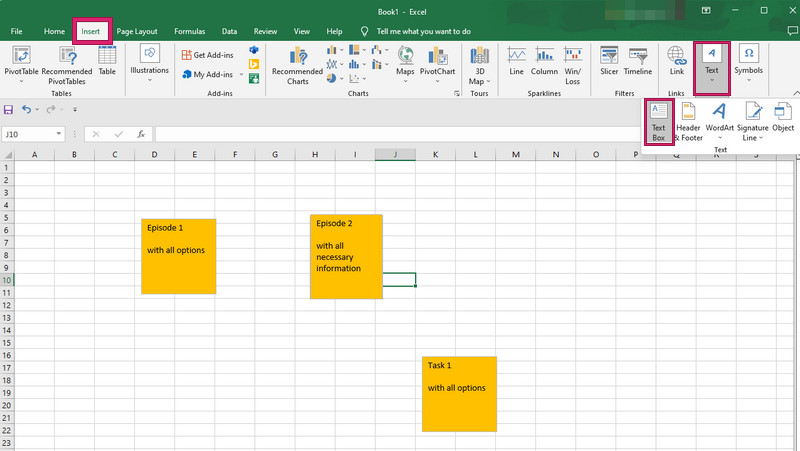
Now, go to the Insert menu from the ribbon part, and hit the Text selection. And from there, click the Text Box option and begin to draw a box on the worksheet. You have the option to put the information already after placing the box or complete and align the boxes first before labeling them.
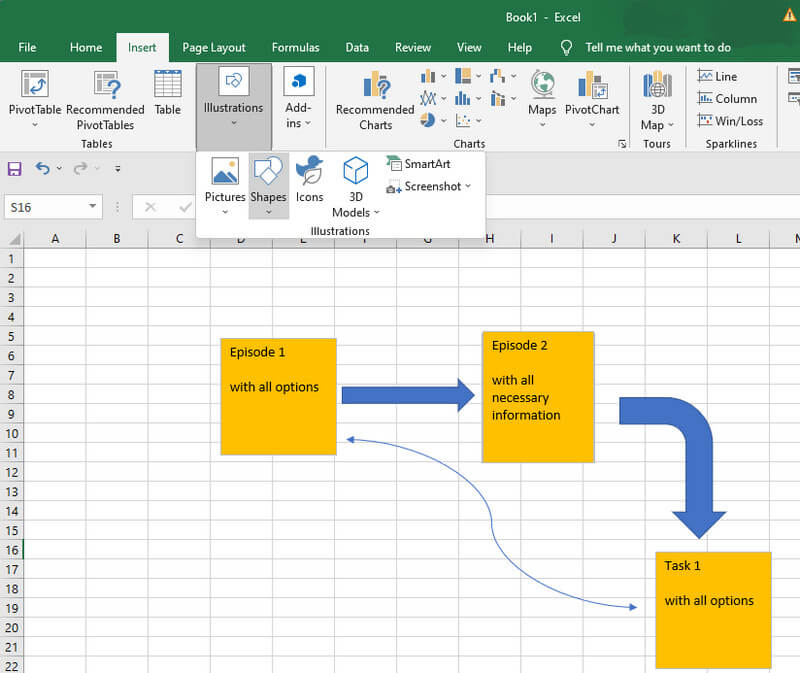
You can add other illustrations like arrows and connectors to complete your PERt chart this time. How? In the Insert menu, hit the Illustrations tab, and select the shapes.
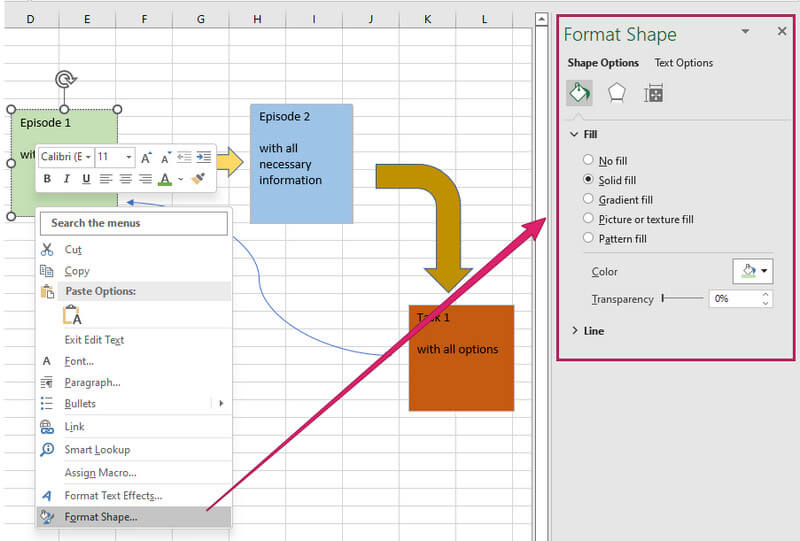
After that, if you want to change the hues of the PERT, right-click on the element that you wish to modify. Then, select the Format Shape option and start modifying the elements on the preset section that popped up on the right part of the screen. Then, feel free to save the PERT chart after. Click here to learn how to create a fishbone diagram in Excel.
Part 3. How to Make a PERT Chart in Microsoft Word
Word is one of the most popular office suits worldwide. And this software can be a tool for creating a PERT with the same procedure as Excel. However, we will show you the SmartArt function's process this time.
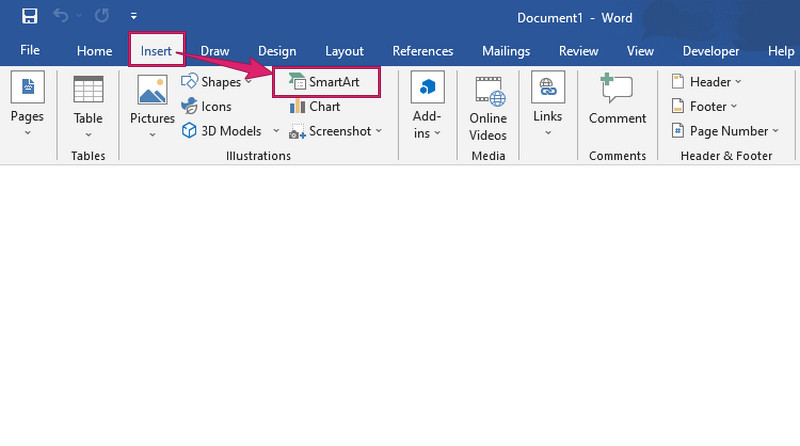
Open a blank page in Word after launching it. Then, click the Insert menu and hit the SmartArt selection there.
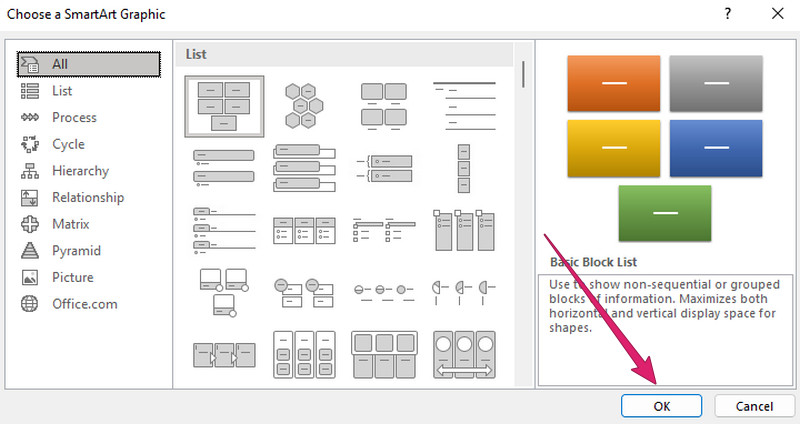
After that, pick a template that you will use for your PERT chart. After choosing, click the OK tab to bring the template to the blank page.
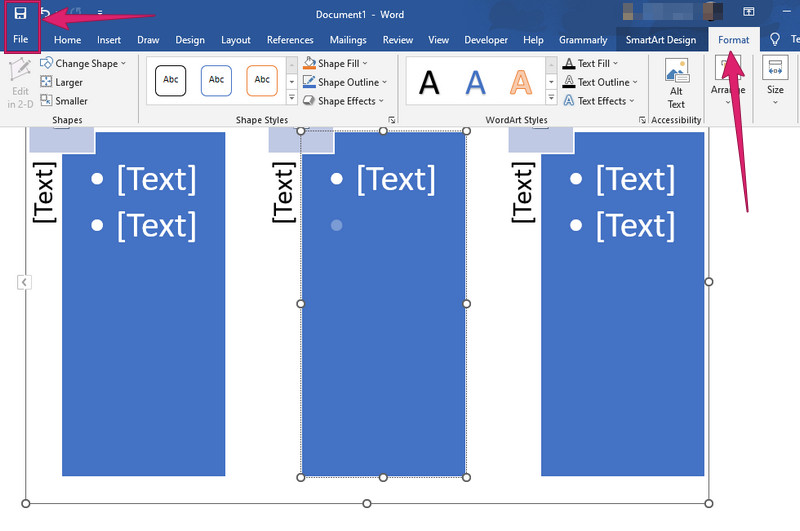
You can now input the data and design of the PERT chart by going to the Format menu. After that, don’t forget to save your chart by hitting the Save icon or the File > Save As selections.
Part 4. FAQs about PERT Chart Making
How to make a PERT chart in PowerPoint?
Making a PERT chart in PowerPoint has almost the same process as in Excel and Word. The only difference is that you must clear the slide's text box before pasting the chart. Then, go to Insert > SmartArt then choose a good template for your PERT.
What are the elements of the PERT chart?
The elements that are used in creating a PERT chart are the duration of time and activity.
What are the things to do when making a PERT chart?
In creating a PERT, you must know to identify, determine, construct, estimate, and update.
Conclusion
You will no longer ask yourself such questions as how do I create a PERT chart especially in Excel and Word. We have already provided you with the solutional guidelines to follow. However, not all computers have these MS suits. For this reason, we gave you the best option for this, and that is through using MindOnMap, an outstanding free PERT chart maker. This way, you can create your chart anytime without needing the software.