What is a Data Flow Diagram: Its Basic Elements, Examples, and How to Make One
We are calling the attention of all who work on data processing. Today will be your lucky day, for you will finally get to understand how a DFD works and the deeper meaning of the data flow diagram symbols that you might need to use. This diagram is an excellent help for those who want to learn and contemplate on the organized information appropriately. Therefore, we want you to be prepared and wise enough in using it. So, relax and continue reading below for a broader knowledge about DFD.

- Part 1. The Profound Meaning of Data Flow Diagram
- Part 2. The Basic Elements of Data Flow Diagram
- Part 3. Examples of Data Flow Diagram
- Part 4. Comprehensive Guidelines on How to Make a Data Flow Diagram
- Part 5. FAQs With Regards the Data Flow Diagram
Part 1. The Profound Meaning of Data Flow Diagram
What is a data flow diagram? DRD is the visual representation of the ideas or information and process of the data in the system. As it says in its name, the DRD purposively shows the flow in terms of how the data goes in and be kept. Furthermore, through a DRD, all kinds of audiences can easily and immediately understand the situation even without a thorough explanation. For this reason, the DRD has undeniably been popular.
Part 2. The Basic Elements of Data Flow Diagram
DRD uses symbols to define information such as arrows, circles, rectangles, and labels, which illustrates the inputs and outputs, relationship, and the direction where the data are being dispatched. Let's proceed to the data flow diagram symbols and notations below to know more about it.
Data flow Diagram Notations:
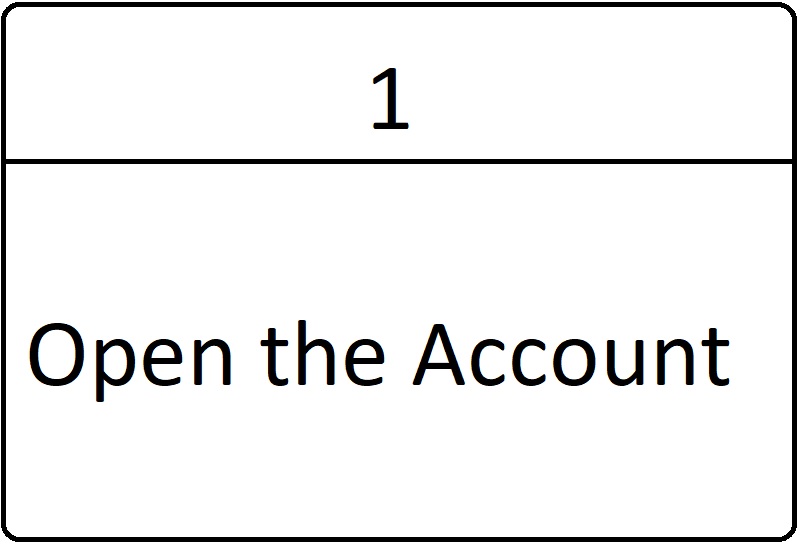
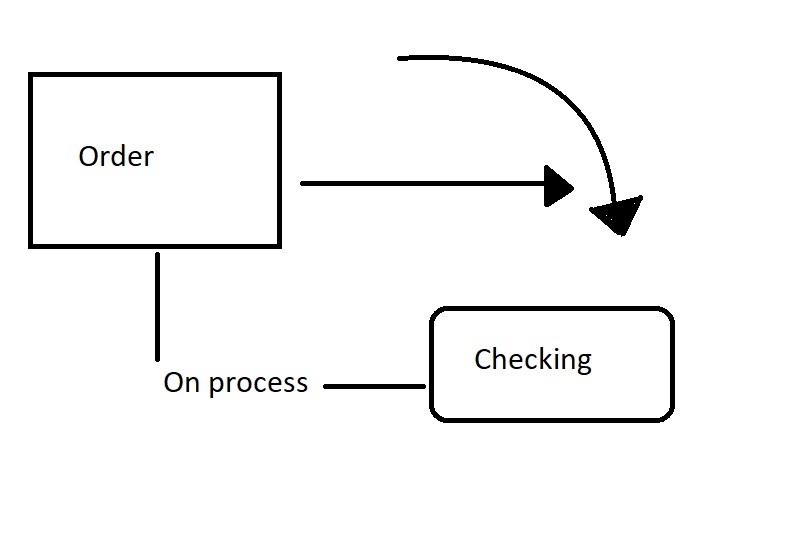
◆ Process Notation - This is the procedure in transforming the data into an output. This notation depicts a rectangular shape but with rounded corners and has descriptive elements, as seen in the sample below.
◆ External Entity - This notation is represented by a square or an oval. External entities are the notations that send and receive data outside the system. In other words, they are the data origin of the information entering and exiting the system. Examples of external entities are people, organizations, events, or situations.

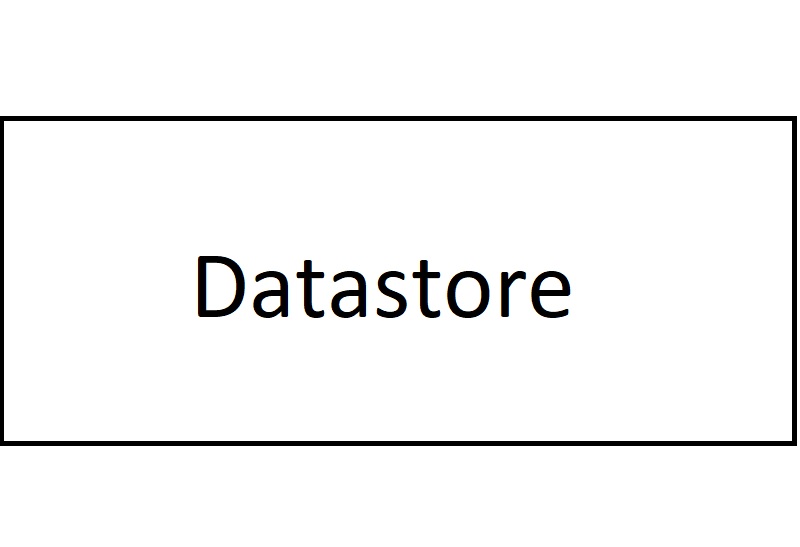
◆ Datastore Notation - A data flow diagram creator should know that the datastores are the repositories or files in the system diagram. These files contain information such as membership form, resume, evaluation, etc. Hence, in the system diagram, they are being labeled with simple words such as “form” within the rectangular container.
◆ Dataflow Notation - The dataflows are the lines that channel the container of information. In addition, these lines or arrows show the description or relationship between or regarding the datastores and entities.
Types of DRD
1. Physical Data Flow Diagram
This type of flow diagram illustrates all the implementations. In addition, it shows all the concerned external entities in the diagram, such as the people, organization, etc.
2. Logical Data Flow Diagram
Logical DRD is the type that focuses on the content of the system. This means that this diagram illustrates more on the course of the organization's data in the system. It is the opposite of the physical DRD because it doesn't focus on external entities.s.
Part 3. Examples of Data Flow Diagram
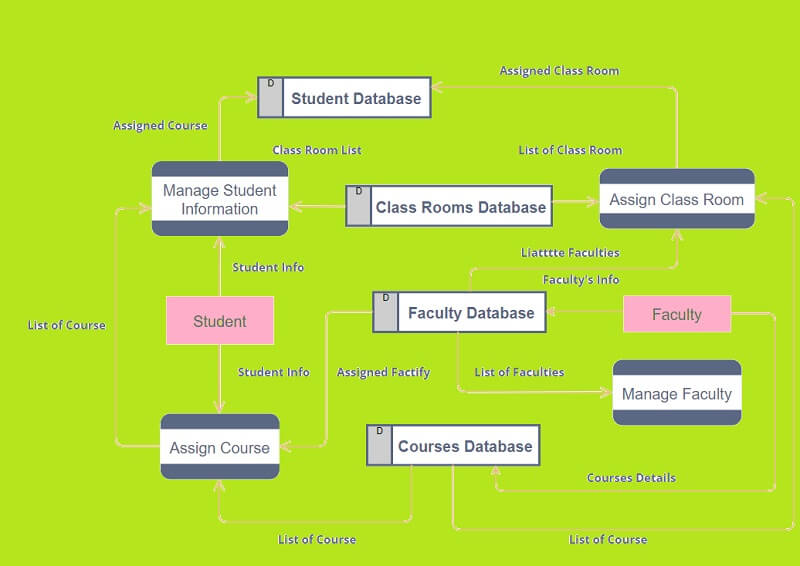
1. School Management System
This sample will show how a school manages from the students, courses, databases up to its faculty. You will see here to what databases the students and the faculty are anchored to.
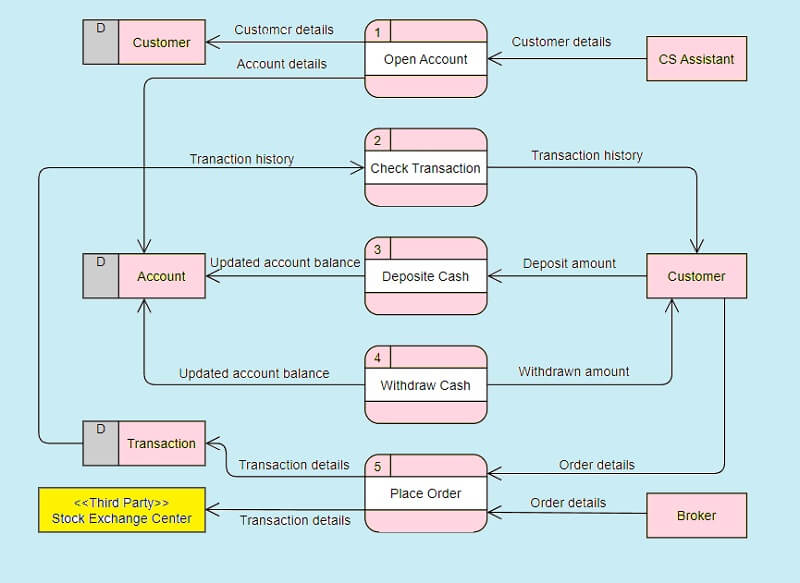
2. Trading System
The trading system is also an exemplary data flow diagram example. As you see in its image, it shows the data being processed and the flow of transactions within the customer, broker, and supplier.
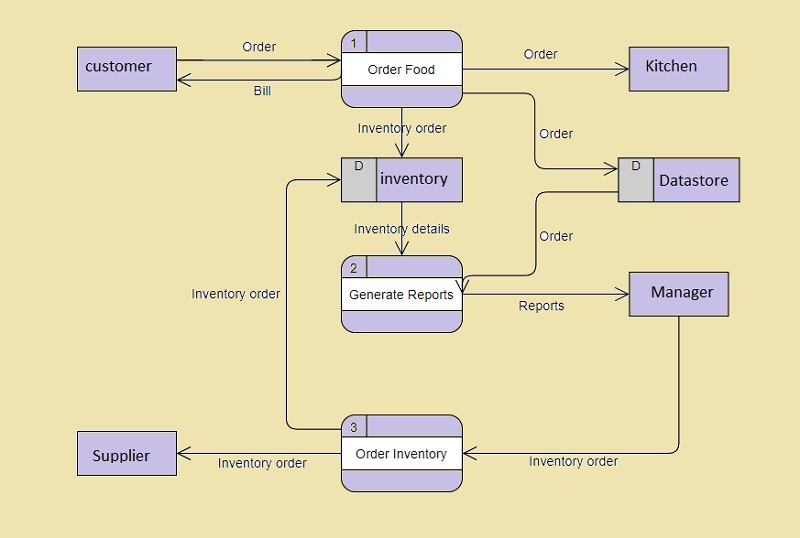
3. Food Ordering System
The last sample will show you the procedure in ordering food for delivery. Furthermore, this also shows the flow of how the manager gets the order from the supplier.
Part 4. Comprehensive Guidelines on How to Make a Data Flow Diagram
Let us now make the craft using the best diagram and mind map maker in history, and we introduce you to MindOnMap, the number one mind mapping tool on the web today. This, too, is an online data flow diagram maker that everyone loves. Well, nobody could chastise on that because this tool really has something to brag about. In general, it has all the options, presets, and beautiful attributes that it offers the users in creating both maps and diagrams.
Secure Download
Secure Download
Furthermore, MindOnMap can keep your masterpiece in the safest gallery made from your email account. Nevertheless, it will enable you to export all your projects, where you will get to print anytime. In addition, you don't need to worry about its price, for you can use this unlimitedly without spending a dime. And so, without further adieu, let's make a data flow diagram online, with the complete and comprehensive guidelines below.
Visit the Website
Open your browser on your computer or on your mobile device, and visit www.mindonmap.com. On the initial page, click the Create Your Mind Map tab, and initiate logging in by using your Gmail account.

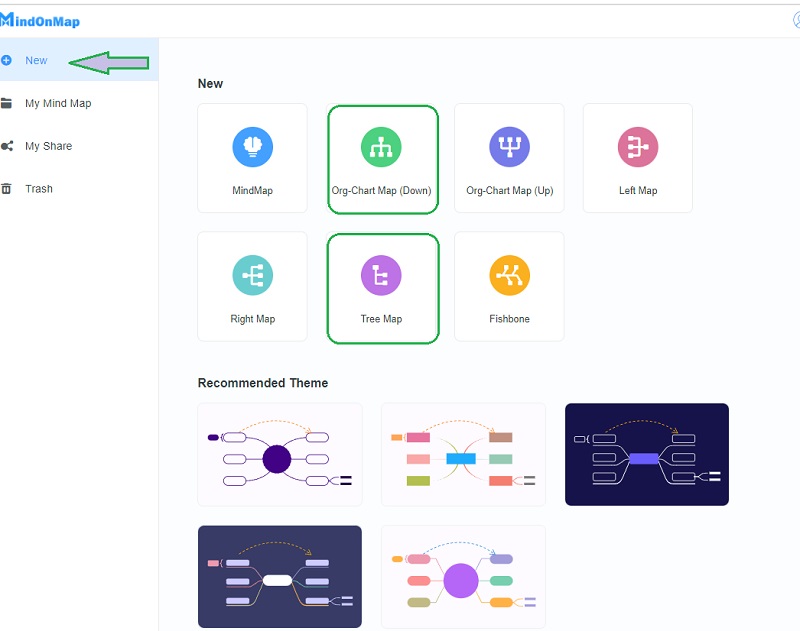
Start at New
On the next page, hit the New tab, then select a theme or a chart from the options. Since we will make a DRD, we suggest you choose the TreeMap or the Org-Chart Map (Down).
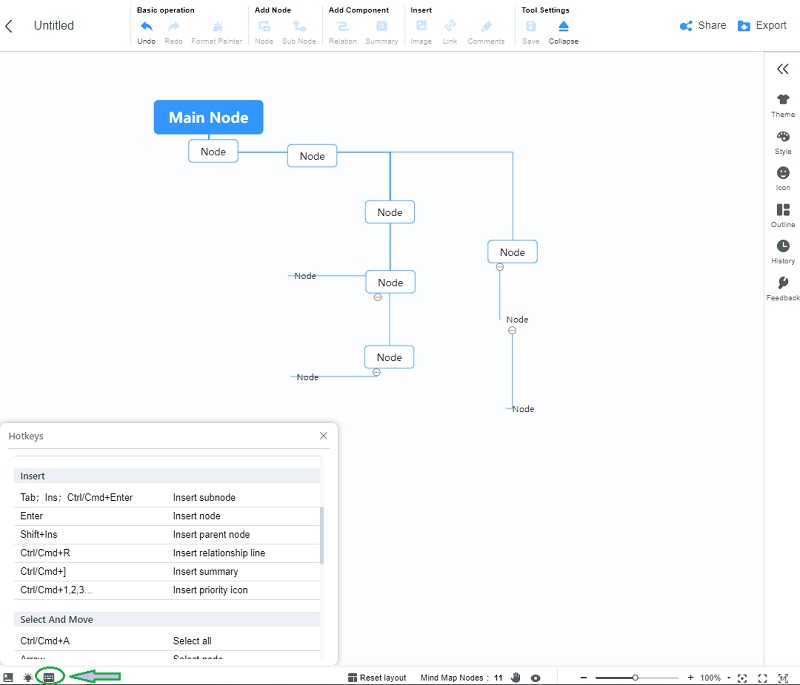
Tip: Know the Hotkeys
You may start navigating this data flow diagram tool when you reach the main canvas. Since you are just looking at the single Main Node, go to the Hotkeys option to see the buttons that will help you in expanding the diagram. Also, if you need to allocate the node, just simply drag it to the location you want it to be.
Step 3. Label the Notation
Apply the notation of the DRD on your nodes by changing their shapes. To do so, go to the Menu bar, and click Style. Then, go to the Shape Style to choose for your entity.
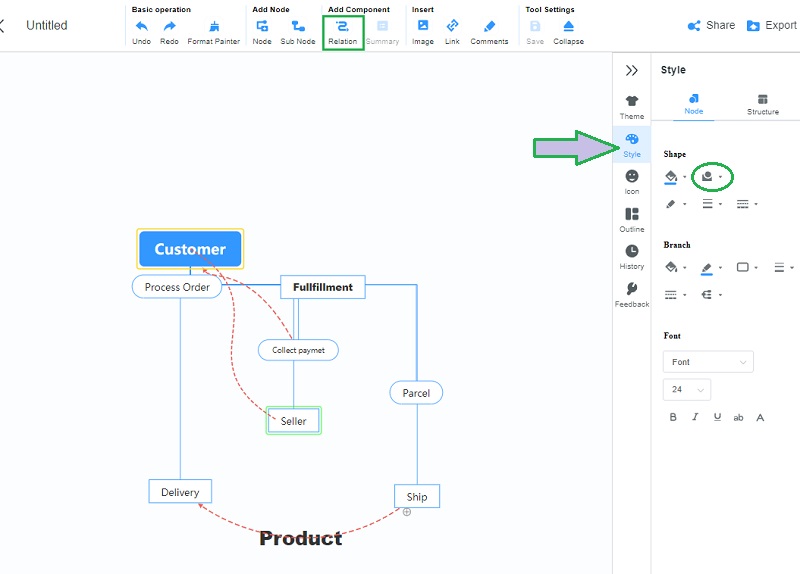
Note
For the dataflows of the pipelines of the data flow diagram example, you may use a node. Otherwise, you may use the Relation tool located at the top part of what we call the ribbon portion, then click the component and feel free to connect the nodes.
Add Radiance
The good thing about this tool is that you can make a radiant diagram by adding colors to it.
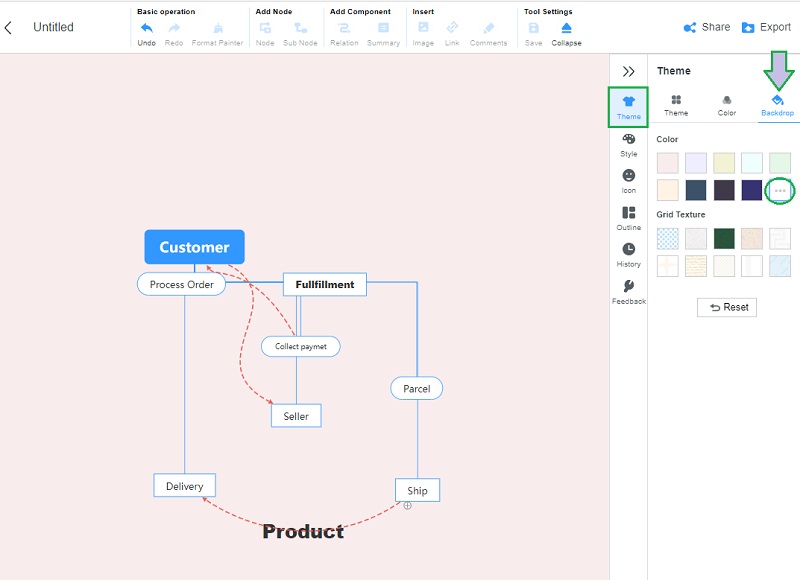
4.1. Change the Background’s Color
Go to the Menu Bar, then from the Themes click the Backdrop. Choose them among the various themes available. Also, by clicking the Slipsys icon, you will be able to personalize a theme to your preference.
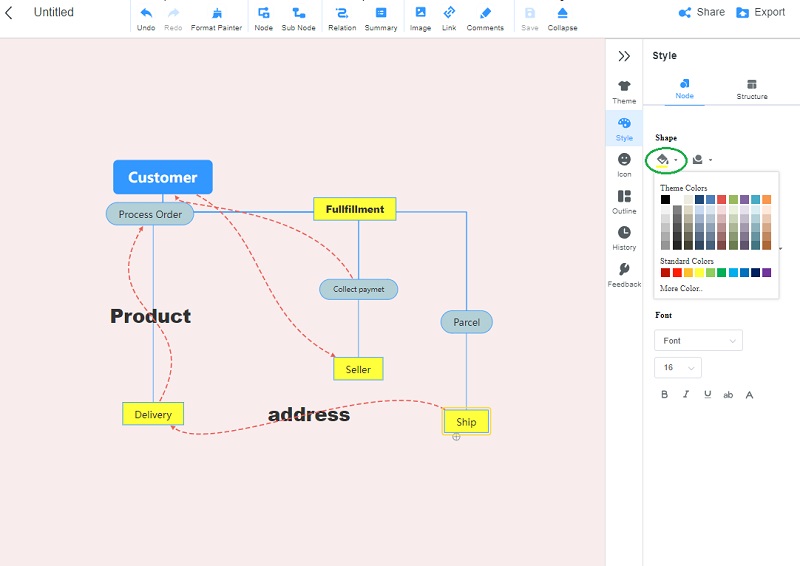
4.2. Add Color to the Notions
To add colors to our data flow diagram's notations, go to Style. Click each node, and hit the Paint icon beside the shape style. From there, choose your preferred color to fill your notation.
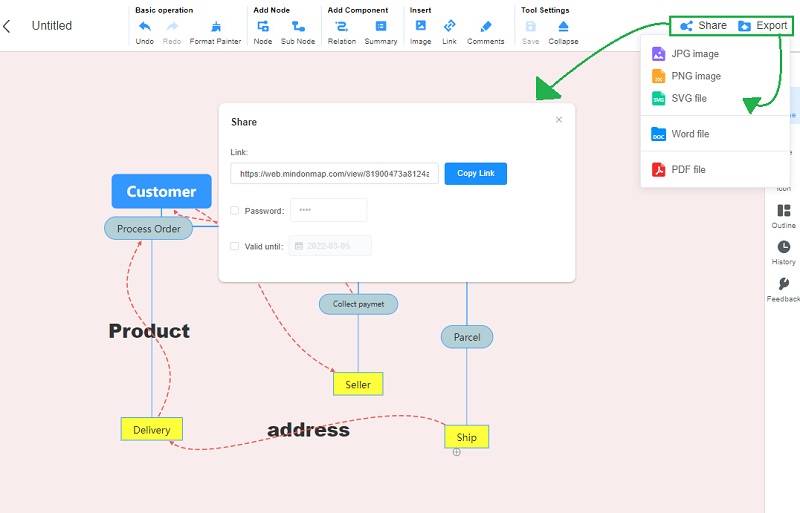
Share or Export
You can finally share or export your diagram, just go to the portion on top of the menu bar. If you want to send the diagram to your teammate for collaboration, click the Share tab. On the other hand, hit the Export button if you long for a printed copy from your device.
Further Reading
Part 5. FAQs With Regards the Data Flow Diagram
How to make a data flow diagram in Word?
Making a DRD using Microsoft Word is a good idea. However, if you are not that knowledgeable in using this program, you will find it confusing and arduous to make, aside from being a paid program.
Who are the creators of the common systems of symbols of DRD?
They are Yourdon and Coad, Yourdon and DeMarco, and Gane and Sarson. Yourdon-Coad and Yourdon-DeMercado use circle processes, and Gane and Sarson use rectangles.
Is Visio good at creating diagrams?
es. In fact, one of the best tools to make a data flow diagram is Visio. However, using it won’t ensure you have a smooth experience, unlike the MindOnMap.
Conclusion
We hope that once you reach this conclusion, you have already embraced all the information given about the data flow diagram. Indeed, this kind of diagram differs from the other diagrams. In fact, there are things to consider and keep in mind before making one. But, once you have already developed and grasped its basic components, you will find it very interesting. Meanwhile, practice by using the MindOnMap not only in making DRD but with creating different types of maps too! Enjoy!