Entity Relationship Diagram: Examples, Symbols, and Guidelines to Make One
Companies that preserve details or information make use of the entity-relationship diagram. This kind of diagram plays a crucial role in keeping a more efficient and more accessible work within an organization. Hence, if ERD is still jargon for you, this is the time that you will know a more profound meaning about it. In addition, we will tackle how this kind of diagram becomes beneficial by imparting connections between the entities of the companies or organizations and how to make a productive one. And so, without further adieu, let us start to dig in by continually reading the information below.

- Part 1. A Profound Definition of Entity Relationship Diagram (ERD)
- Part 2. Learn the Symbols Used in an Entity Relationship Diagram
- Part 3. Examples of the Entity Relationship Diagram
- Part 4. Different Tools in Making Entity Relationship Diagram
- Part 5. Questions Frequently Asked About Entity Relationship Diagram
Part 1. A Profound Definition of Entity Relationship Diagram (ERD)
What is an Entity Relationship Diagram?
ERD is a visual model showing the connection of entities within the Database. In which, an entity of this Database refers to the objects or the components that define the company's properties. Furthermore, this diagram is commonly used to control the information security system, software development, and education in developing a relational database. People not engaged in a company can also use ERD because using this diagram can also display the connections between concepts, items, locations, people, or events.
The Benefits of Using ERD
The following are only a few of the multiple benefits of an entity-relationship diagram tool.
1. Managing Information in the Organization/Company
ERD helps the organization or the company in improving its operations. How? Presenting a relationship model of their activities involving their daily operation would make it easier for them to see data and enhance the flow of the process accurately.
2. Fixing Database
ERD helps debug the database by contemplating its data within it and resolving the possible and apparent issues shown in the diagram.
3. Redeveloping of Business Operations
The DRD is also a great way to redevelop business operations anytime and reconstruct a more effective system00…
Part 2. Learn the Symbols Used in an Entity Relationship Diagram
To deepen your understanding, we will be talking about the entity-relationship diagram symbols. These characters play a significant role in dispensing the relationship and meaning of the data being tackled.
Entity Symbols
There are three different types of entity symbols. These symbols are being used in representing concepts or entities, which are usually in a noun form such as location, customer, product, and promotion.
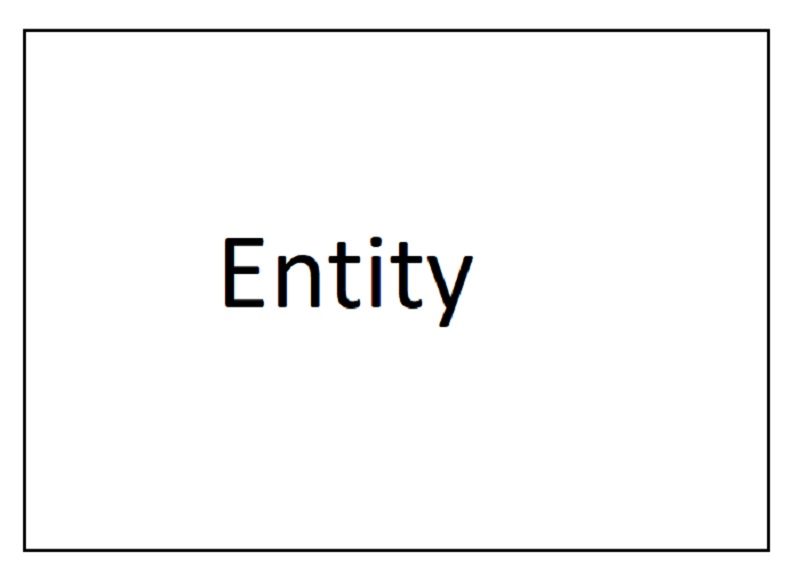
1. Strong Entity - This symbol is also known as the central entity. It is a rectangular shape that contains an object that is not dependent on other entities. In other words, the potent entity symbol has the primary object and plays the mother among others when creating an entity-relationship diagram.
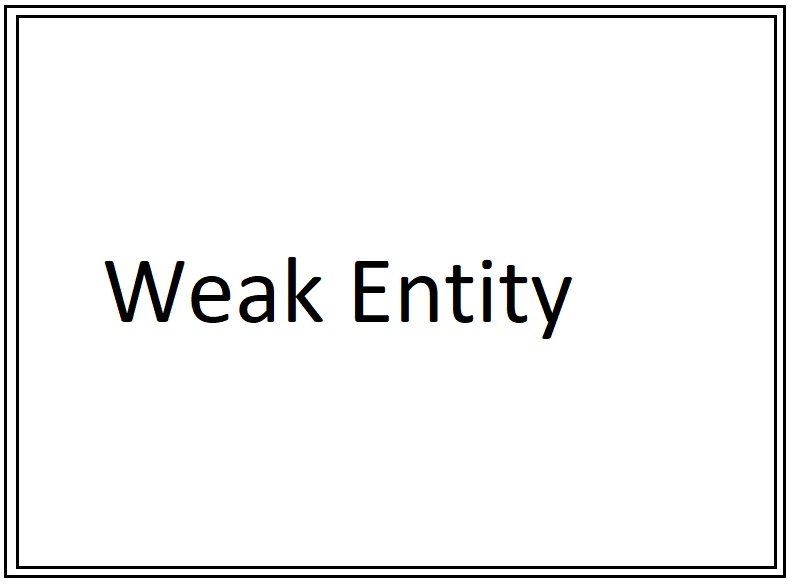
2. Weak Entity - This shape symbolizes a dependence from a parent entity. In addition, it has no significant keys and meaning apart from the main entity.
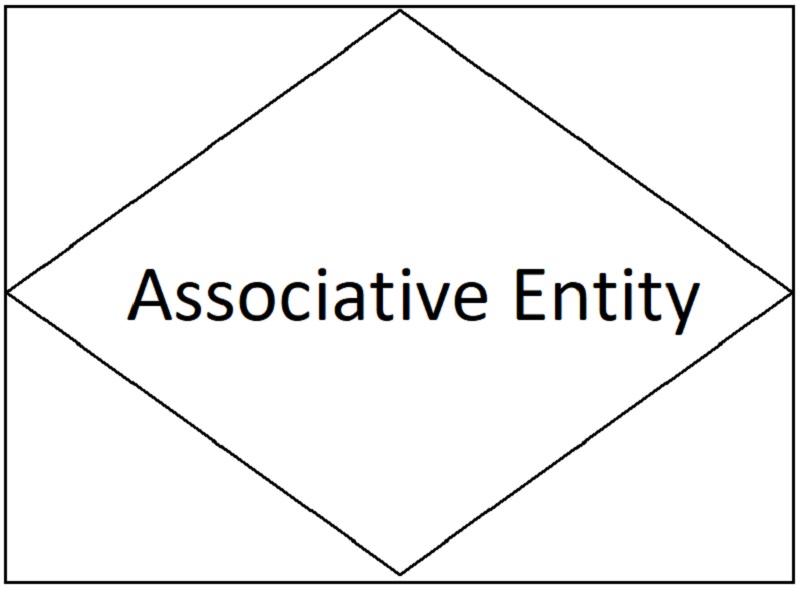
3. Associative Entity - the associative entity correlates the occurrences of other entities. The word associate symbolizes association between the entity instances.
Action Symbols
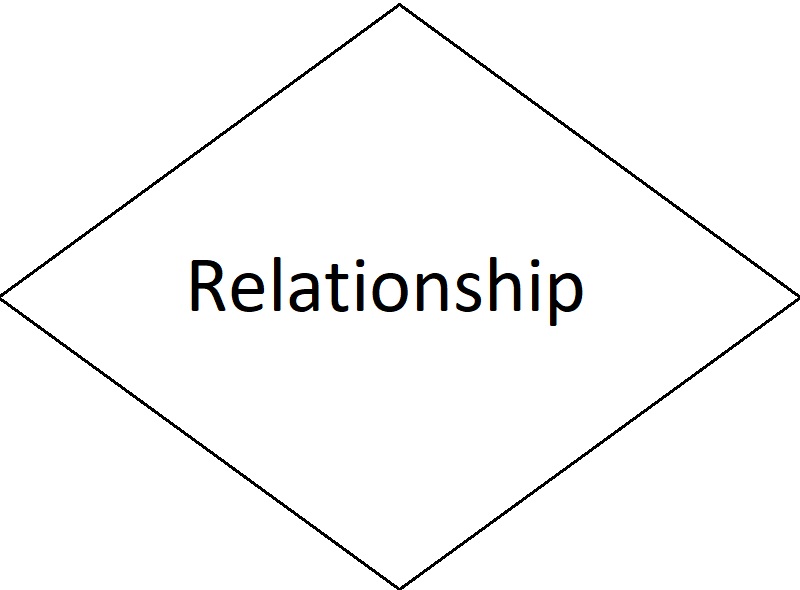
The action is also called the relationship symbol. These entities are presented by a diamond shape and used to display the shared information of the two or more entities. If the entity uses noun words, the relationship or action symbols contain verbs.
Relationship - From its word, this symbol shows the connections of the two or more entities within the entity-relationship diagram.
Attribute Symbols
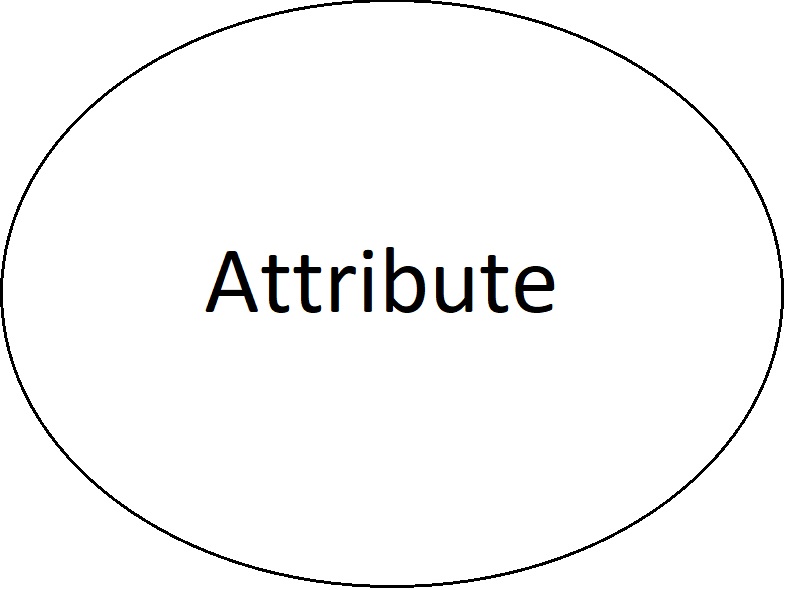
The attribute symbols are the ones used to show the characteristics and the details of the different entities in the database.
1. Attribute - It is an oval symbol containing the detail of the entity. For instance, the entity which pertains to a member of the group, one of his personal details can be shown in an attribute symbol.
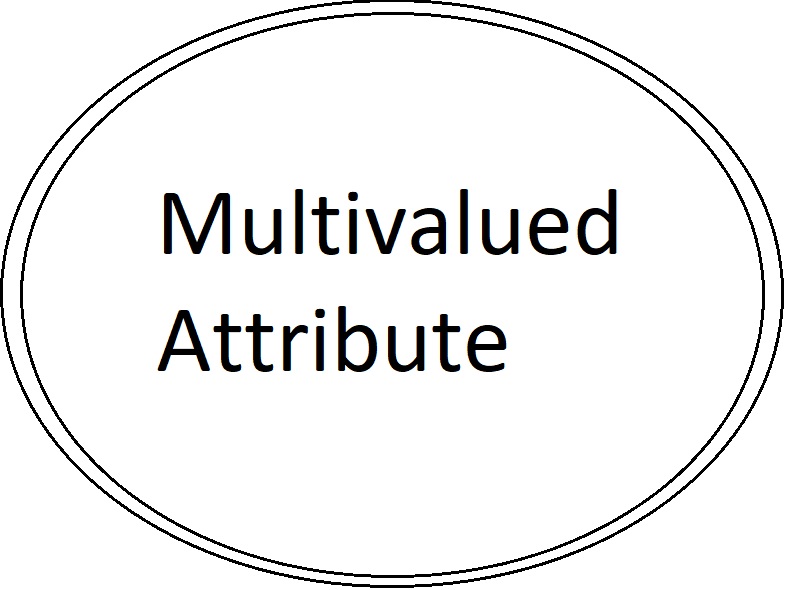
2. Multivalued Attribute - This kind of attribute contains two or more values. Based on the example, the member’s entity can connect to numerous abilities or discounts.
Part 3. Examples of the Entity Relationship Diagram
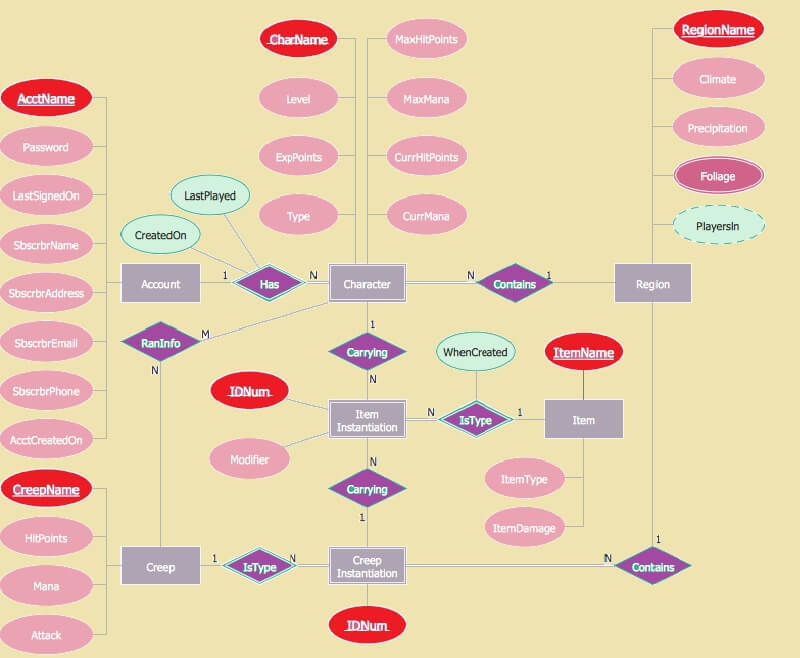
Chen Diagram
Chen diagram is a simple entity-relationship diagram example of one of the commonly used ERD solutions today. This kind of ERD diagram uses stand-alone boxes to show attributes. Also, it presents graphics and icons needed to develop a complex database following this notation.
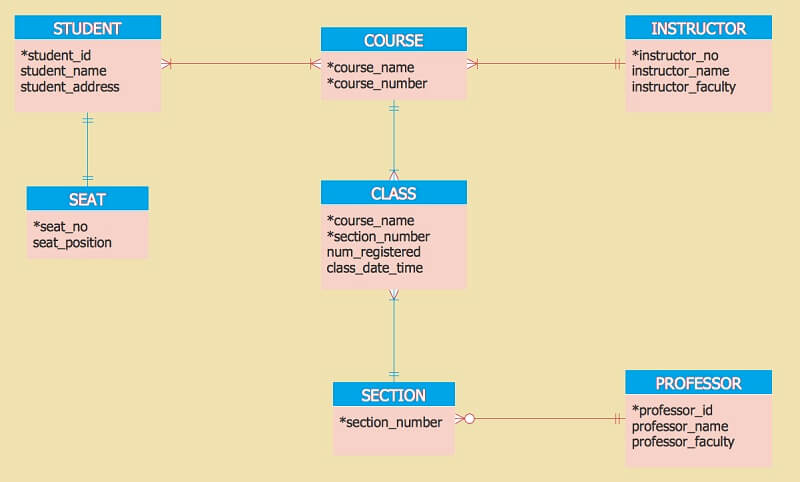
Crow’s Foot Diagram
Gordon Everest originated the crow’s foot diagram. In addition, this kind of ERD or entity relationship diagram uses the ER models to make a table to be a reference to other databases.
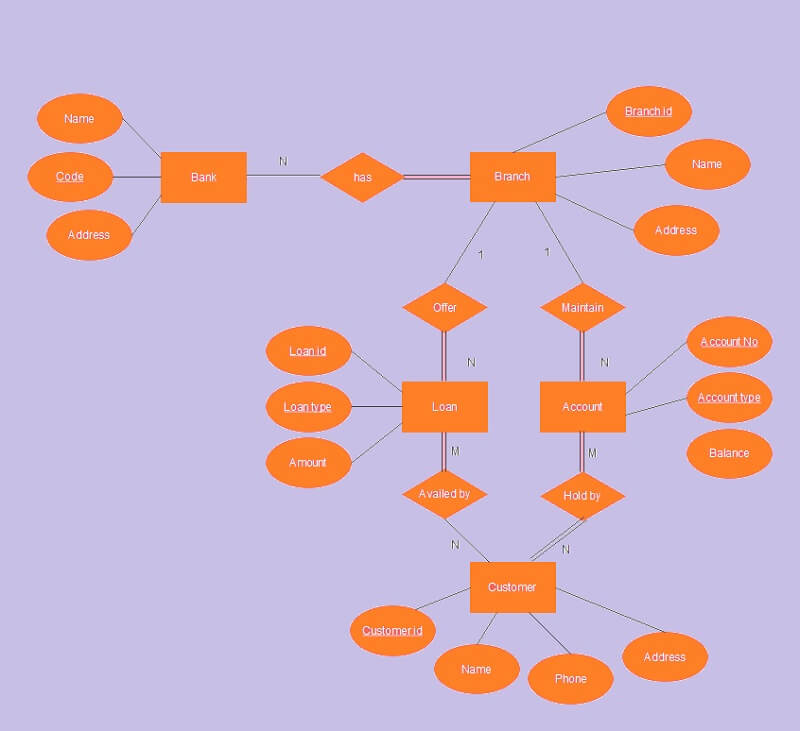
Bank Management System Diagram
This kind of ERD is used in the banking industry to help the bank secure the entities within the bank, such as the customers, accounts, assets, employees, and transactions. In addition, this entity relationship diagram example is very crucial in managing the valuable assets and properties, including cash of the members, especially the customers.
Part 4. Different Tools in Making Entity Relationship Diagram
There are lots of ERD makers that you can use nowadays. Hence, in this article, you will be brought the finest tools that you deserve.
1. MindOnMap
We introduce you to the most reliable and undeniably the most excellent online ERD maker in town, the MindOnMap. Furthermore, this talk-about tool offers tons of wonderful features and presets. MindOnMap is an online tool that creates entity-relationship diagrams for free. Yes, this is the full-featured mapping tool with the extraordinary ability to create relationship maps that you will love!
What’s more, its key features will excite you even more. Imagine, you can continually create your map anytime, for it automatically saves your work. Also, it will allow you to easily share your masterpiece with your co-workers by just doing three clicks from your mouse! To cut the excitement, let us see the detailed steps that you can follow and enjoy in making an efficient ER diagram.
Secure Download
Secure Download
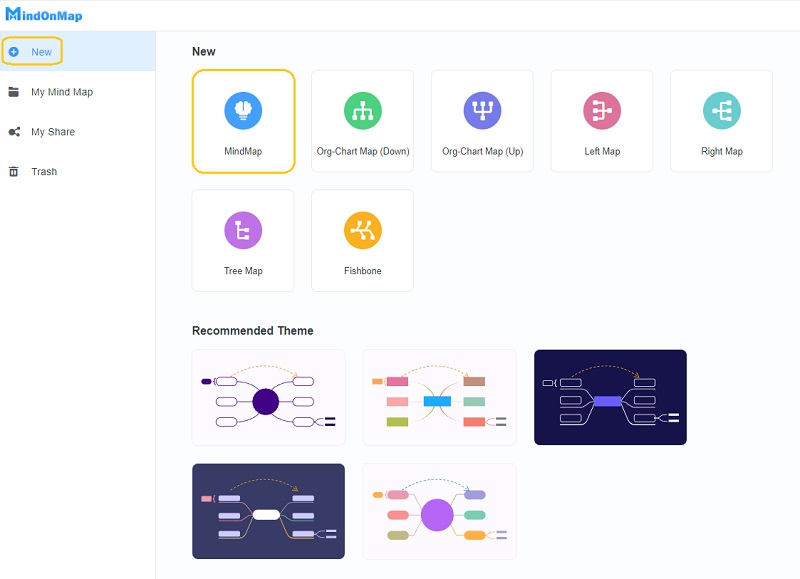
Access the Tool
On your browser, go to the official website and access it by logging in to your email account. Then, start creating your entity relationship diagram online by clicking New and choosing the MindMap among the choices templates.
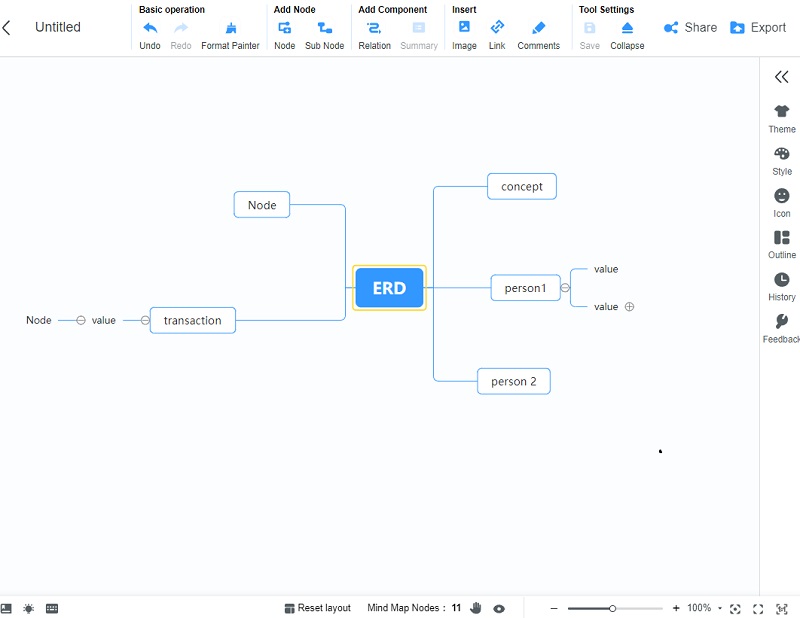
Create the Entities
In adding entities, you just have to add nodes by clicking the TAB on the main node. Continually add a node until you reach your target number of symbols for your database. Name them according to the data. Note that you can drag the nodes and place them where you need them to be.
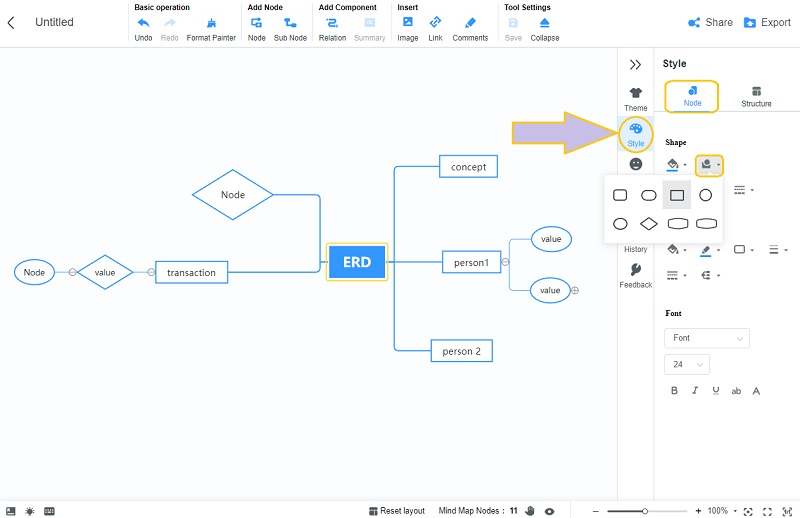
Customize the Shapes
To present your entities well according to their meaning, place them into the right symbol. Change the shape of the nodes of your simple entity relationship diagram example by going to the Menu Bar>Style>Node>Shape. Choose among the given options for your node.
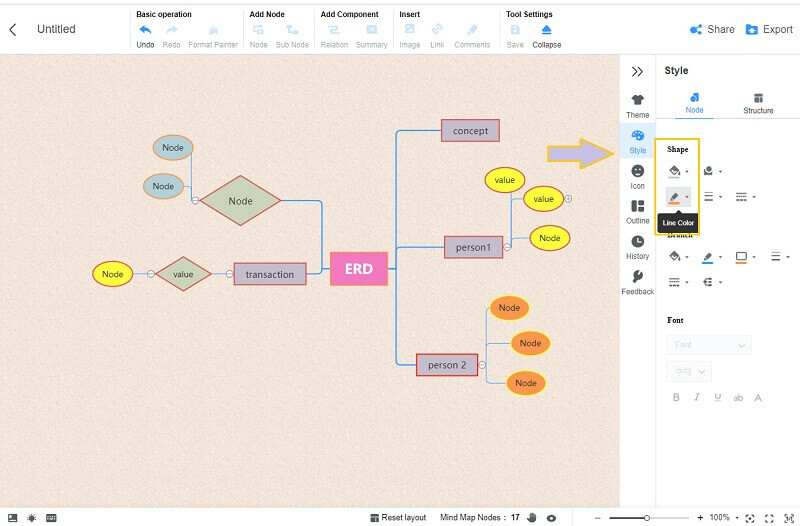
Bring Radiance to the Diagram
To bring life to your masterpiece, try putting some colors on it. To change the background, go to Theme, and customize the Backdrop. To add colors to the entities, go to Themes, then choose among the colors to fill the nodes. Also, it enables you to have customized the line color for extra beautification.
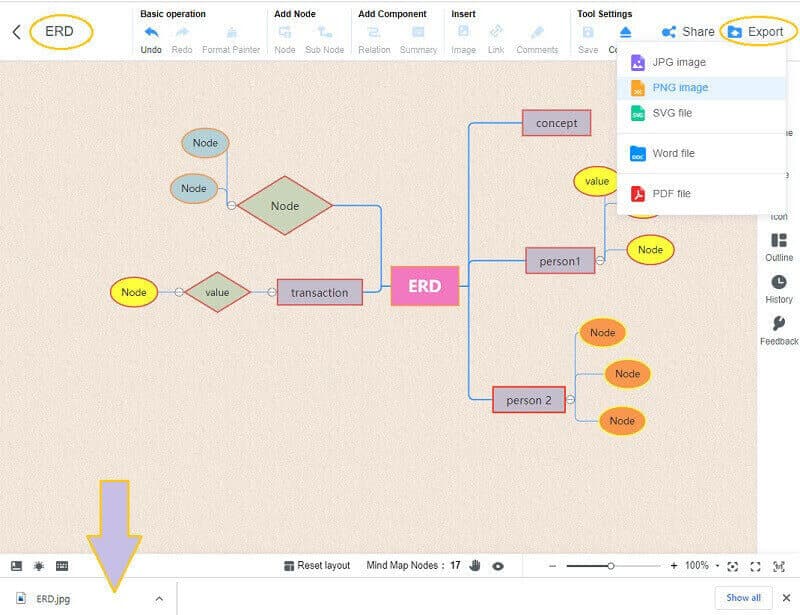
Save the Diagram
Just what we have mentioned previously, this tool automatically saves any changes you make. Hence, if you want to have a copy of the finalized entity relationship diagram on your device, choose to save it, click the Export button, and select your preferred format. Afterward, you already have your copy downloaded, as seen on your screen.
2. Visio
Another on-trend when it comes to creating constructive diagrams, charts, and maps, is the Visio. Furthermore, this Word-like tool of the Microsoft family offers great stencils, icons, and templates that will turn your diagrams into the most exquisite ones. Hence, utilizing the tool for free will not let you enjoy it longer, for its free trial version only lasts for a month unless you afford and get its grand plan. On the other hand, how can we make an entity-relationship diagram with Visio? See the steps below.
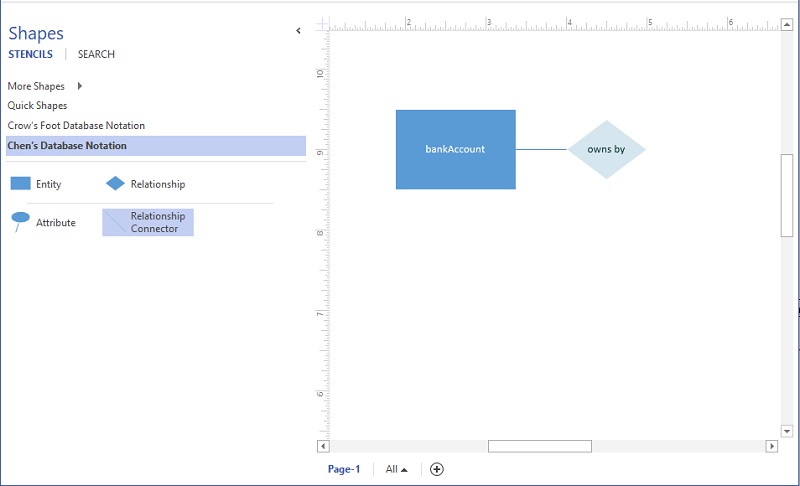
Launch Visio, and click the File tab to select New. Next, choose the Database then the Database Model Diagram.
On the next window, click the Relationship tab. Toggle one on the box under the Show tab, then hit OK.
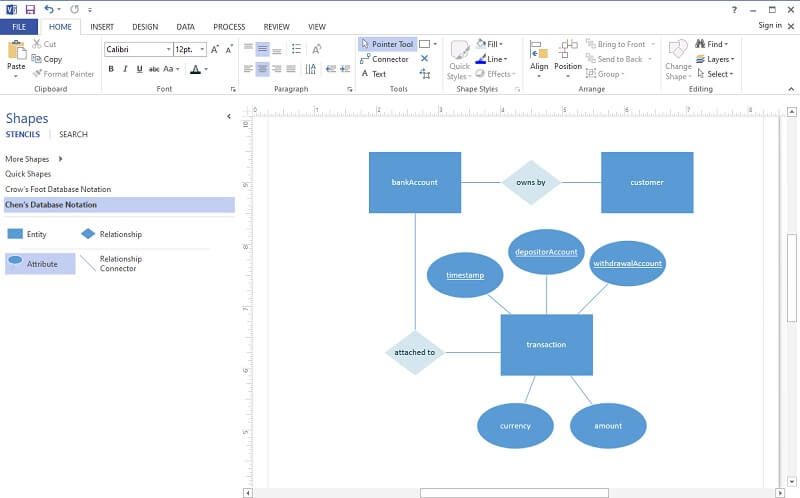
Start making your diagram by dragging and dropping the shapes on the main canvas. For you to customize the entities, double-tap each and start naming them.
Finalize the diagram and subsequently export it. To do so, go to File, then click Save.
3. Powerpoint
Are you wondering how you will make an entity-relationship diagram template with Powerpoint? This program can also be used to make various visual representations, including diagrams, charts, and maps. As part of the Microsoft family, Powerpoint can get extra credit, for it offers and enables the users to present their project with multiple options such as 3D, Geometric Color Block, and Urban Monochrome set up. But today, let us create from scratch using a blank presentation, follow the simplified guidelines below, and create your own with us at the same time.
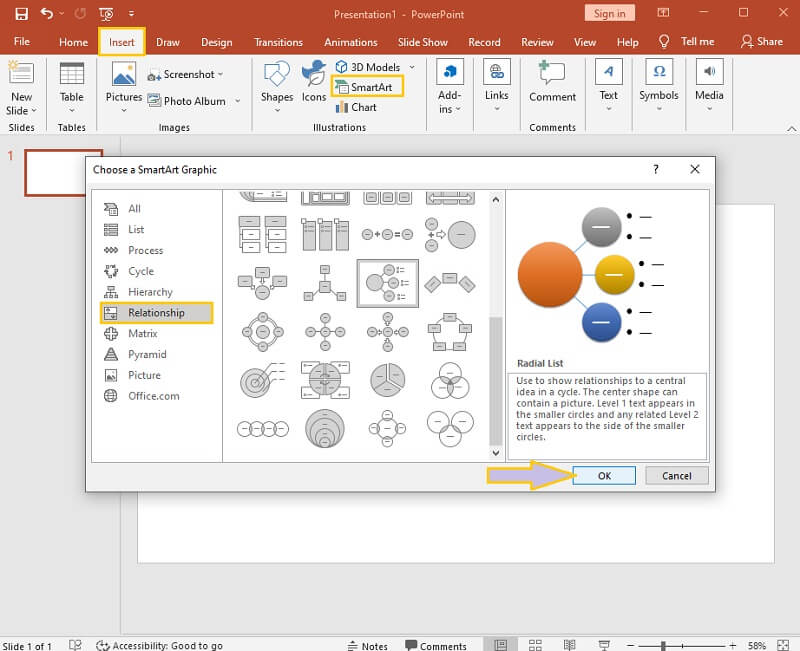
Launch the software, and on the main page, click the New, then Blank Presentation.
On the presentation page, go to Insert and click SmartArt. Through this, you will be able to choose and use a ready template for the entity-relationship diagram by choosing one from the Relationship then clicking OK.
Change the shape of the entities by right-clicking the node, then select Change shape. Subsequently, rename to label all the nodes on the database.
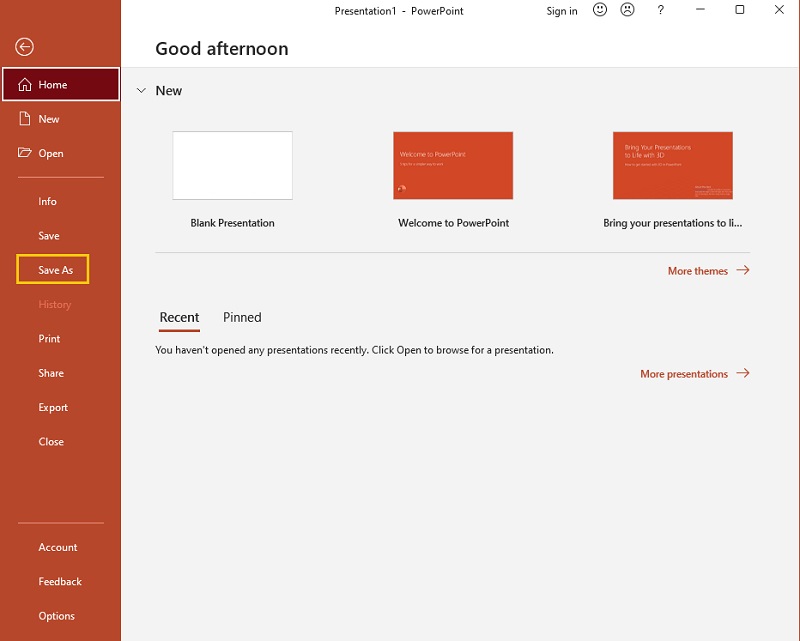
To save the project after finalizing it, go to File, then choose Save As.
Further Reading
Part 5. Questions Frequently Asked About Entity Relationship Diagram
Can I use Microsoft Excel in making ERD?
Yes. Microsoft Excel is commonly used in making maps, charts, and diagrams as well. In addition, it has features and tools, the same as Powerpoint and Visio, that are being used in making ERD.
Can I make an entity-relationship diagram without the symbols and meaning?
Yes. In making a personal ERD, you don’t need to follow all the symbols and meanings. Hence, in making one for a company, the symbols are quite important to follow.
Can I put images in the ERD?
As the database is concerned, including images in the ERD is not applicable. Although, you can still include one as you prefer.
Conclusion
To conclude, we are pretty sure that you already understand what an ER diagram really means. By the definition, samples, and guidelines in making one, we hope you were able to acquire knowledge and understanding about the entity-relationship diagram, and the tools in creating one. To end, use the MindOnMap for a greater experience in mapping and diagramming.