Learn the Easiest Way on How to Create an Infographic
How to make an infographic easily? Well, you must be grateful since we will introduce an excellent tool with simple steps to follow for creating an infographic. Also, we will share the various capabilities you can enjoy during the procedure. So, if you want to get all the understandable procedures for creating an infographic, come to this post and follow all the given steps.

- Part 1. How to Make an Infographic in MindOnMap
- Part 2. How to Create an Infographic in Word
- Part 3. How to Create an Infographic in PowerPoint
- Part 4. Canva Infographic Tutorial
- Part 5. FAQs about How to Make an Infographic
Part 1. How to Make an Infographic on MindOnMap
Creating an Infographic is a challenging task. It requires different elements to get your outcome. Also, it is best to always consider the right tool when creating infographics. In that case, we would like to introduce MindOnMap as an excellent infographic maker. This tool is capable of creating infographics more efficiently. It is because it can provide easy-to-understand layouts that are perfect and workable for skilled and non-professional users. It can also provide helpful functions which can be convenient for all users. It includes different font styles and designs, themes, tables, colors, shapes, and more. With these functions, it will ensure you obtain amazing and understandable infographics. What’s more, the tool allows you to insert an image by adding the link, making it an excellent infographic maker.
Aside from that, MindOnMap offers a hassle-free method when making infographics. It will only take at least five easy steps to finish your final output. Moreover, the tool also can save your infographic in various ways. If you want to preserve the final output, you can save it on your MindOnMap account. If you want to download the infographic, you can do so. It lets you save the infographics in JPG, PNG, PDF, and other formats. Furthermore, the tool is available on both online and offline platforms. You can download its offline version on your Windows and Mac computers. If you prefer creating the infographic online, you can use the web-based version and begin the procedure.
To learn how to create an infographic using MidnOnMap, check the simple procedure below.
The first step is to proceed to the website of MindOnMap. Then, the software will ask for your account. You can create an account or use your Google account. After that, you can choose if you want to use the offline or online version of the infographic creator.
Secure Download
Secure Download

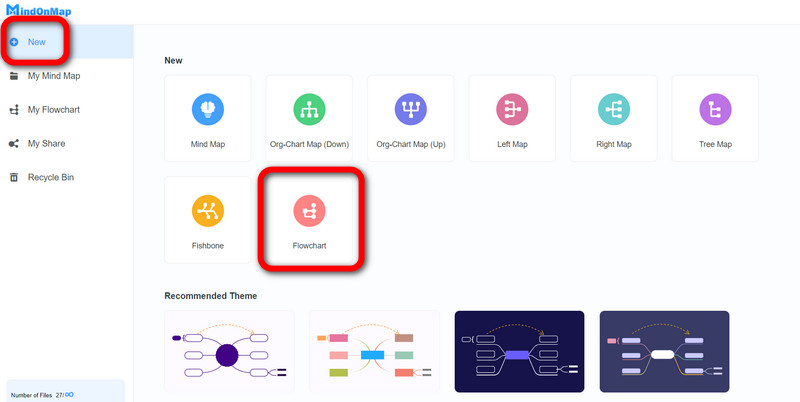
For the second step, click the New section from the left interface. When various options show up, navigate to the Flowchart feature. After clicking, you will encounter the MindOnMap’s main interface. Then, you can proceed to the next process.
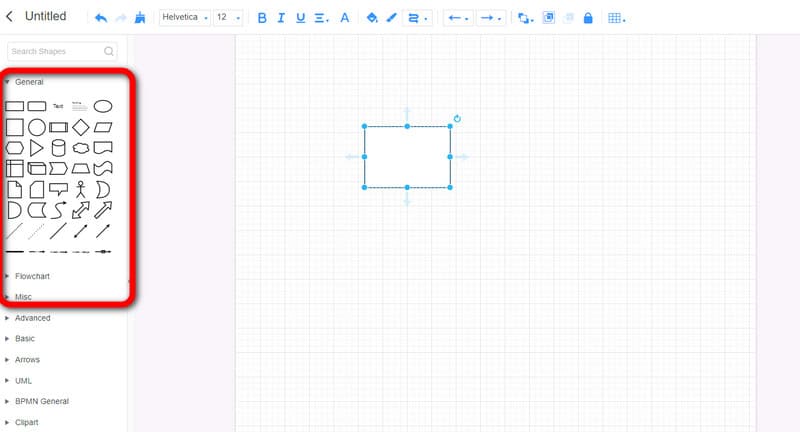
From the main interface, you can start creating the infographic. Go to the General option and drag and drop the elements you need on the plain canvas. After that, you can also change the sizes of the shapes you selected.
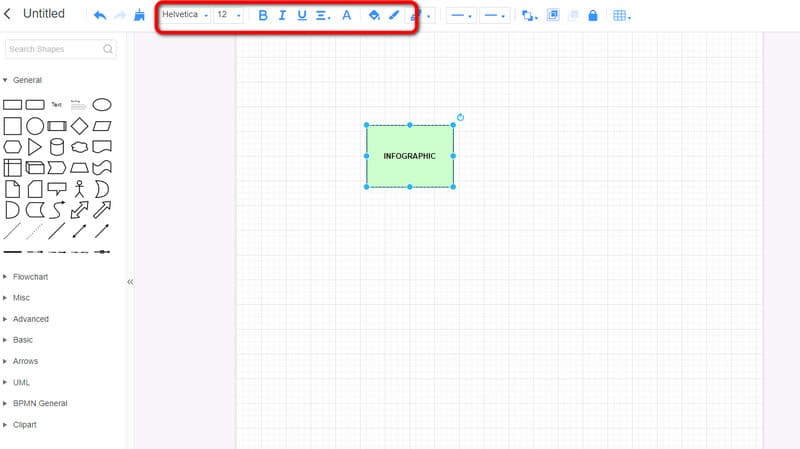
To add text in the shapes, you can double-left-click the shape and insert the text. You can adjust the text size from the Font Size function. You can also utilize the Fill Color option to add various colors for each shape. These functions are on the top interface.
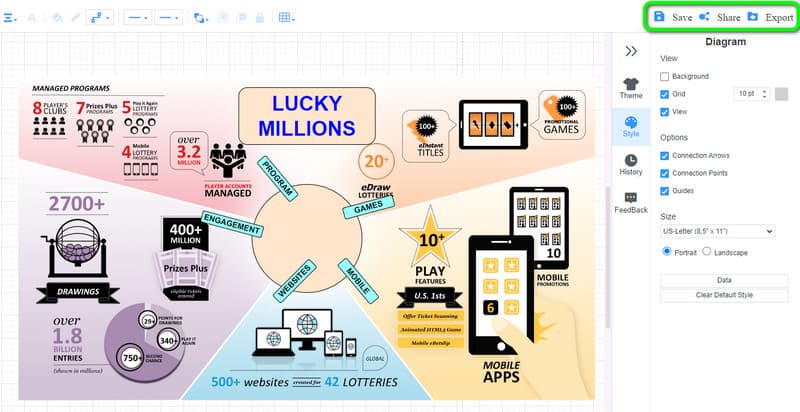
Once you are done creating your infographic, you can begin the saving procedure. You can press the Save option to save the infographic on your MindOnMap account. Also, you can download the output on your computer using the Export button. Lastly, you can share the link of the infographic using the Share option.
Part 2. How to Create an Infographic in Word
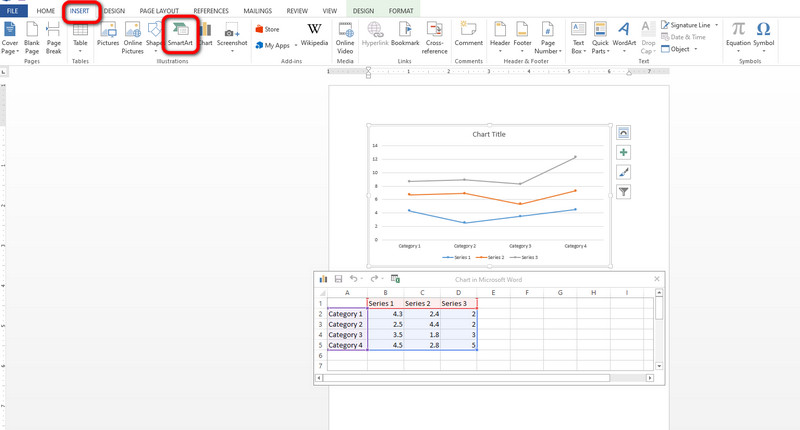
Microsoft Word is also another offline program to use for creating an infographic on your computer. If you are not yet aware, the program is not only reliable on being an excellent platform for creating written content. MS Word is also capable of making infographics with its various functions. For additional information, Microsoft Word is capable of providing various shapes, designs, font styles, tables, and more. With these functions and elements, you can make an understandable infographic that is helpful for users. And you can use Word to make Gantt charts. Moreover, the program offers ready-to-use templates. These templates can be helpful, especially for users who don’t want any hassle during the creation process. However, there are some issues you must know when using the program. Microsoft Word is not that easy to utilize. Some functions are hard to navigate. This way, it is recommended to ask for guidance from a professional when using the program. Also, you must purchase a subscription plan to access the program, which is expensive.
Download the Microsoft Word on your computer and begin the installation process. After that, launch the program to view its main interface. You can open a blank page and begin the process.
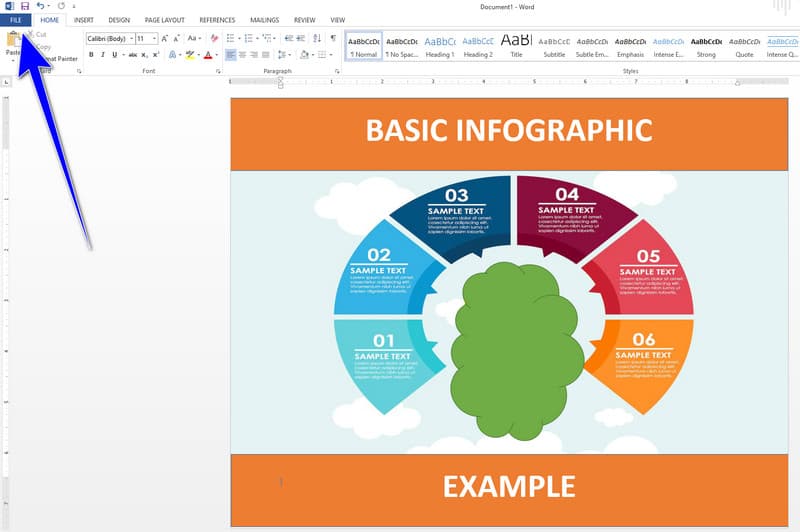
For easier procedures, you can use the free templates from the program. Go to the Insert section and click the SmartArt options. After that, you can select your desired template for your infographics. Then, attach all the data you need on the infographic.
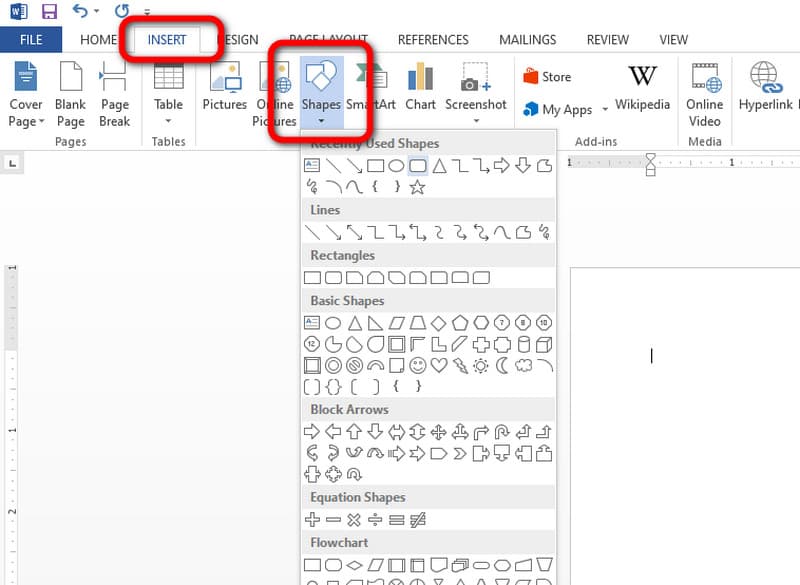
If you want to create your infographic manually, you can go to the Insert option and click the Shape function. Then, right-click the shapes and select the Add text function to insert the data from the shapes.
When you are done creating the infographic, go to the File button on the top interface. Then, select the Save as option and begin saving the final output on your computer.
Part 3. How to Create an Infographic in PowerPoint
Microsoft PowerPoint proves to be a valuable tool for crafting infographics without the need for an internet connection. It offers a range of functions to enhance the infographic creation process, allowing users to incorporate desired elements. These are shapes, curved lines, arrows, text, and more. Furthermore, the option to insert images directly from the program adds to its versatility. So, you can tell that MS PowerPoint is among the best infographic makers to use. Despite these advantages, the program's main interface is perplexing, and its cost and operational time can be significant drawbacks. But if you want to know how to create an infographic in PowerPoint, follow the methods below.
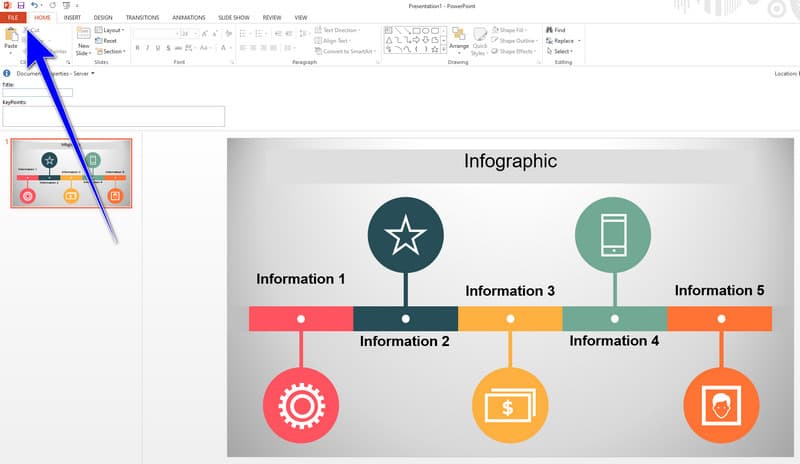
Open a blank presentation after downloading and installing the Microsoft PowerPoint on your computer.
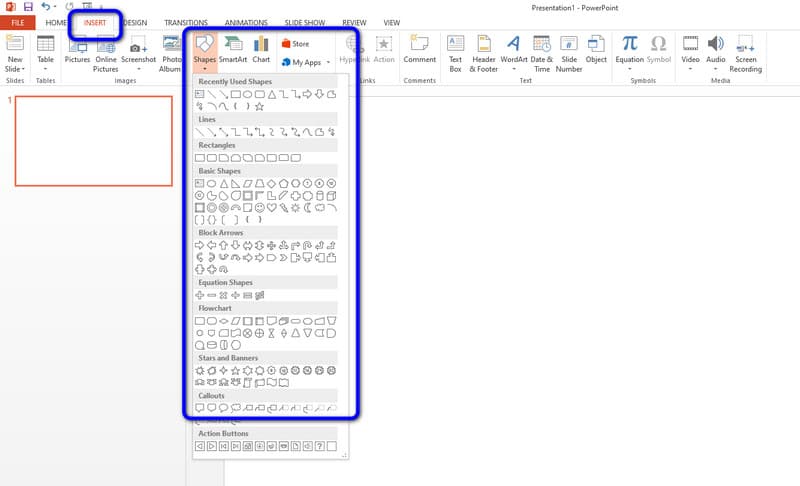
From the top part of the interface, click the Insert option. Then, hit the Shapes to show all the provided shapes from the program. Select the shape you want for the infographic. You can also insert text by clicking the shape twice using the left click from the mouse.
After you have created the infographics, you can save it by clicking the File button. You can also save the output in your preferred file format.
Click here to get how to make a decision tree with PowerPoint.
Part 4. Canva Infographic Tutorial
Canva stands out as a flexible online platform enabling users to create diverse visual content, including infographics. Its user-friendly interface, featuring drag-and-drop functionality, caters to individuals with varying design expertise. For an easy process, you can also search for infographic templates. The tool can provide various templates you can use for free. However, a robust internet connection is essential when using the tool and accessing advanced features requires opting for the paid version. Thus, Canva is a notable choice among online infographic generators.
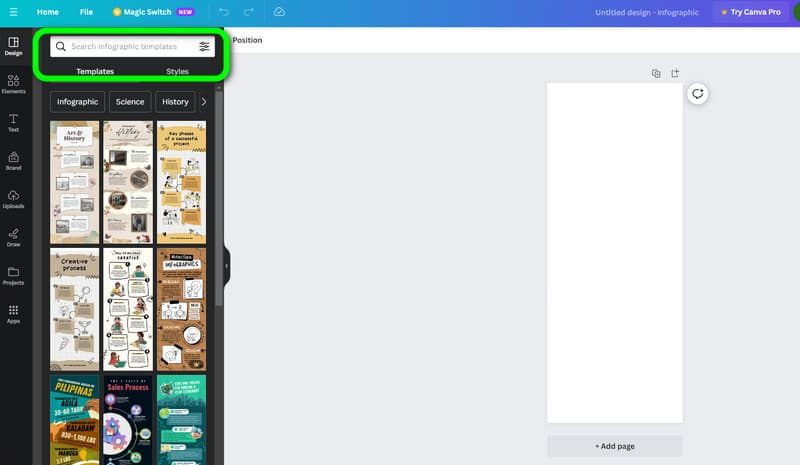
Open your browser and navigate to the official website of Canva. You can also use the free version of the tool to access it conveniently.
You can ask for the free infographic template from the tool. When various templates show up, select your preferred one.
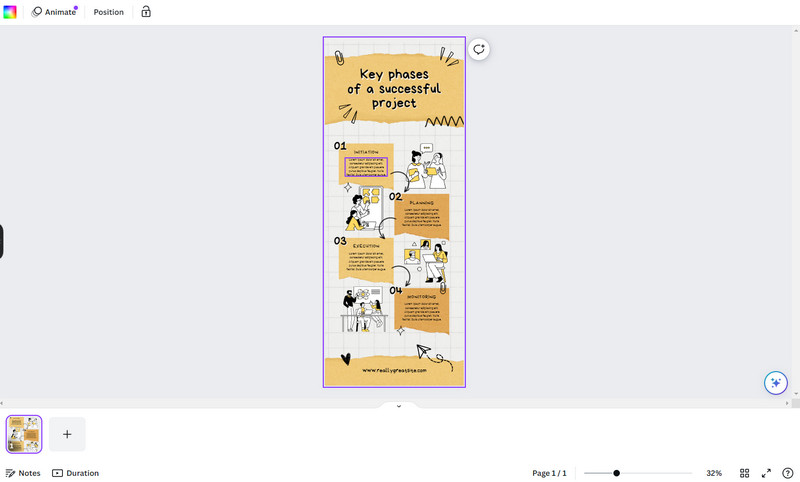
Then, you can begin editing the templates and insert all the data you need for your infographic.
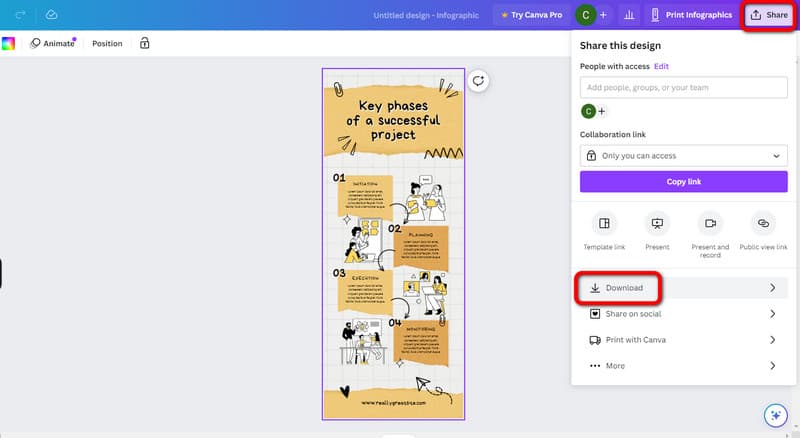
When you are done creating the infographic using Canva, proceed to the saving process. Click the Share > Download button to get and download the final infographic.
Part 5. FAQs about How to Make an Infographic
What are the 5 easy steps to make an infographic?
First is to define your purpose and audience. You must know your goal and the possible audience in your infographic. The second one is to gather information you will put on your infographic. After that, the third one is to select a design tool that suits your skills. You can use graphs, charts, images, and more. The fourth one is arranging elements. It is better to create an engaging layout that may attract audiences. Lastly, review and refine. Ensure that your infographic is organized, well-designed, and informative.
Can you make an infographic in Google Docs?
Definitely, yes. Google Docs is capable of creating infographics using its functions. You can insert images, tables, text, and more.
What are the 3 types of infographics?
These are the Informative, Statistical, and Timeline Infographic. The informative shows data, facts, and information in an organized format. The Statistical infographic is focused on numbers. Lastly, the Timeline infographic is about the chronological order of an event.
Conclusion
Now you know how to make an infographic using various infographic creators. This way, you can have an idea about the process. However, some programs are hard to operate due to its complicated interface. If that is the case, use MindOnMap. Compared with other tools, it has an easier user interface and offers all the functions you need. It is also workable on both offline and online platforms, making it more accessible for all users.