Complete Tutorials about How to Make A Bar Graph Conveniently
Many users are having a hard time when creating their bar graphs. They don’t know what to do and how to start. Some users have no idea what software they need to use. If you think creating a bar graph is difficult, read this post. We will give numerous trouble-free ways to make a bar graph online and offline efficiently. Read the post right now and start discovering all the information you need.

- Part 1. How to Create A Bar Graph Free Online
- Part 2. Way to Make Bar Graph in Word
- Part 3. How to Make A Bar Graph in Google Docs
- Part 4. FAQs about How to Make A Bar Graph
Part 1. How to Create A Bar Graph Free Online
To create a bar graph for free, use MindOnMap. This web-based bar graph maker can provide everything you need for the bar graphing procedure. You can use a rectangular bar, lines, text, font styles, numbers, and more. Also, if you desire to put and change the color of the shapes, you can do so. The tool can offer a Color Fill tool to make your graph attractive and pleasing. In addition, MindOnMap can provide numerous themes for the background color. All the themes are free, making them convenient for users. Moreover, the tool has an intuitive interface with a simple procedure for bar graphing. You can ensure that professionals and beginners can easily operate the tool. you can export the finished bar graph to various formats. It includes PDF, PNG, SVG, DOC, JPG, and more.
Another feature you can encounter while using MindOnMap is the auto-saving feature. Every time you make changes to your graph, the tool can save your work automatically. With the help of this feature, you don’t have to worry about possible data loss. Another feature is the collaborative feature. The tool allows you to brainstorm and collaborate with other users instantly. By sending the link of your bar graph, you can let them view your work and edit the graph if necessary. MindOnMap is available to all browsers, like Google, Safari, Firefox, Explorer, and more. Use the instructions below to make a bar graph using MindOnMap.
Secure Download
Secure Download
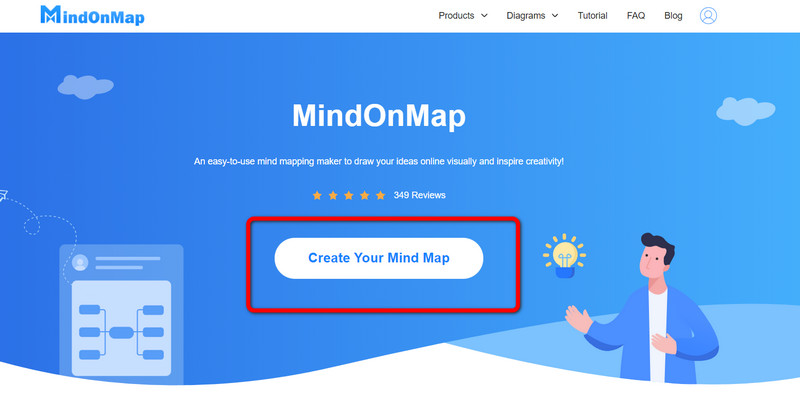
Open your browser and go to the main website of MindOnMap. Then, create your MindOnMap account. You can sign up or connect your Gmail account to access it easily. After that, click the Create Your Mind Map button on the center web page.
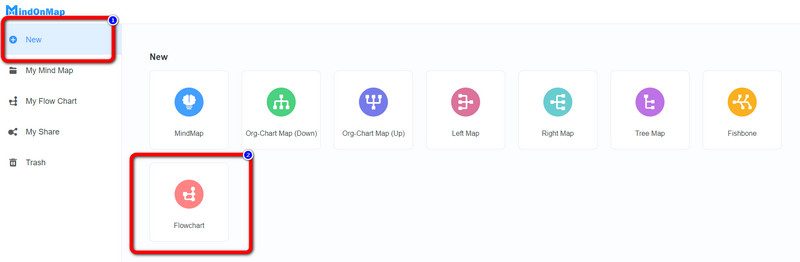
After clicking, a new web page will appear on the screen. On the left part of the web page, select the New option. Then, click the Flowchart option to proceed to the main interface.
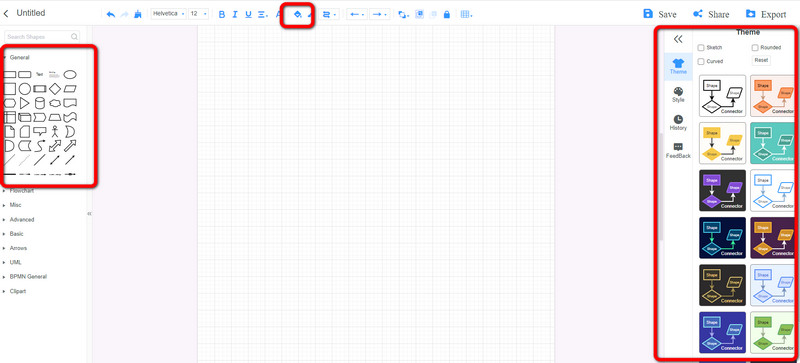
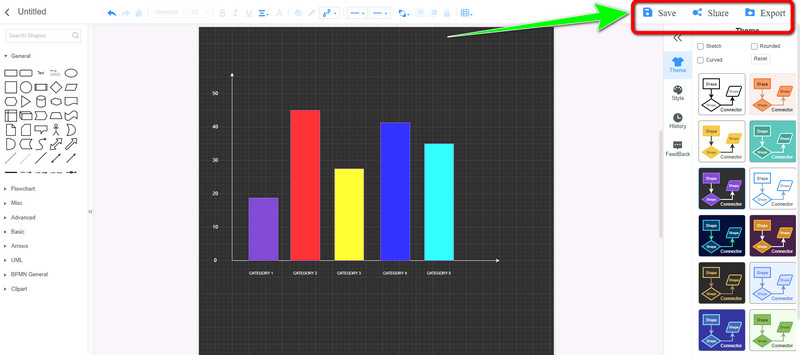
In this part, you can already see the tool's main interface. It has everything you need for your bar graph. Go to the left interface to use rectangular shapes, lines, text, and more. If you want to add colors to the shapes, click the Color Fill option on the upper interface. Then, go to the right interface to use free themes.
For the final step, when you are done creating a bar graph, proceed to the saving process. Click the Save button to save the bar graph on your MinsOnMap account. To share your output with other users, click the Share option and copy the link. Lastly, click the Export button to export the bar graph in PDF, PNG, SVG, DOC, JPG, and other formats.
Part 2. Way to Make Bar Graph in Word
We have the best solution if you prefer creating your bar graph offline. To create a bar graph, use Microsoft Word. This offline program is capable of helping you to make a bra graph efficiently. It can provide everything you need while creating a bar graph. You can use shapes, font styles, backgrounds, text, and more. It can also allow you to change the color of the shapes based on your preferences. In addition, Microsoft Word can provide free bar graph templates. This way, if you are a beginner and want to make a graph easily, you can use these templates. You can instantly insert all the data for your graph and finish your work quickly. Moreover, this offline program doesn’t require highly skilled users. Microsoft Word has an intuitive layout, which is suitable for all users. Microsoft is accessible on both Mac and Windows computers.
However, despite its excellent capabilities, Microsoft Word has a limitation. The templates you can use are limited. Also, to experience its full features, you must get the paid version. But the software is expensive. Also, installing the program has many processes, making it complicated for non-professional users. Follow the steps below to know how to make a bar graph in Word.
Download Microsoft Word on Windows or Mac operating systems. Then, proceed to the installation process. After that, launch the offline program.
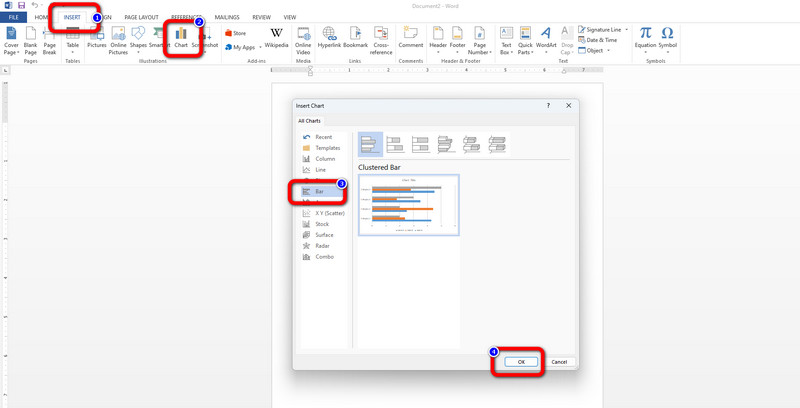
Open a blank document to start making your bar graph. Then, navigate to the Insert menu on the upper interface. Then click the Chart > Bar option, and select your preferred templates. You can use Horizontal or Vertical bar templates and click OK.
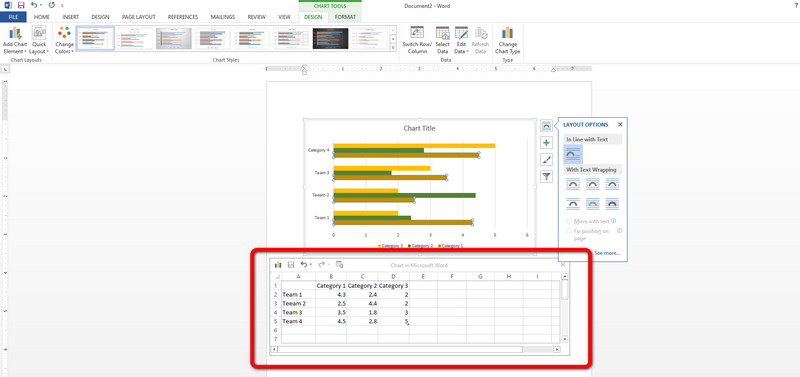
Then, insert all the data you need on your bar chart. To change the bar's color, double-right-click the shape and click the Fill Color option.
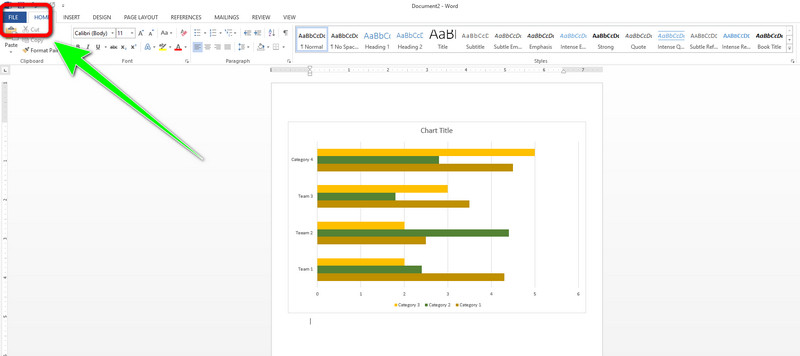
When you finish creating the bar graph, save your final output. Navigate to the File menu and click the Save as option.
Part 3. How to Make A Bar Graph in Google Docs
Google Docs is also an effective online tool for producing bar charts. This bar graph creator is simple and perfect for all users. Bar graph templates are available in Google Docs, which is helpful. It also provides an automatic saving feature. This way, the output won't be lost if you unintentionally shut off the computer. You may also download and save it in different formats, including DOC and PDF. Moreover, the shareable file allows you to email the bar chart to others.
However, Google Docs have drawbacks. Since it is an online tool, it won't operate without an internet connection. Using the tool is also time-consuming. You need to create your Google account first before creating a bar graph. Use the method below to learn how to make a bar graph in Google Docs.
Go to your browser and create your Google account. Then, go to your Gmail and select the Google Docs tool. After that, open a blank document.
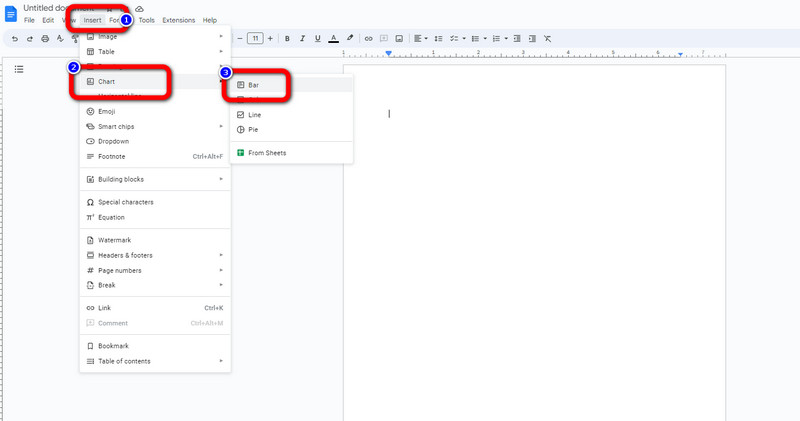
Click the Insert > Chart > Bar option to use the free bar graph template. After that, the template will appear on the screen.
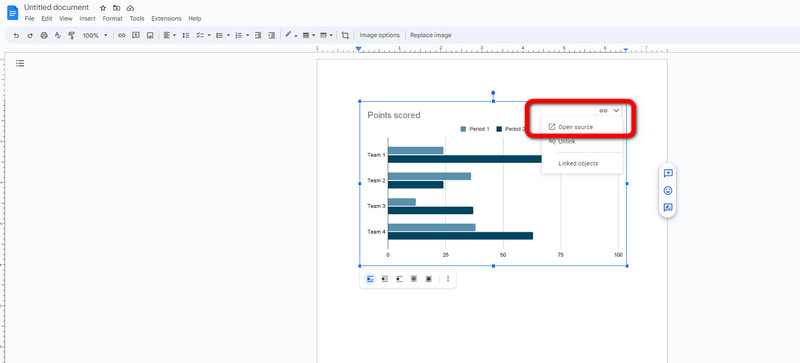
Click the down arrow option on the free template and select the Open source option. Then, a sheet will appear on the screen, and edit and insert all the data for your bar graph.
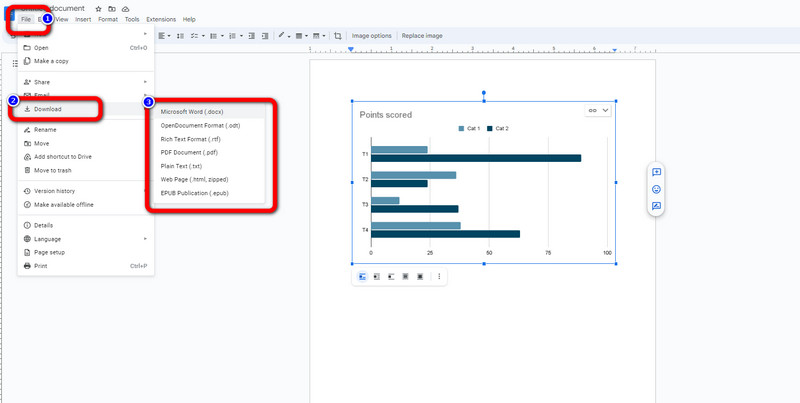
After creating a bar graph, go to the File > Download option. Then, select your preferred format.
Part 4. FAQs about How to Make A Bar Graph
1. What is the purpose of a bar graph?
One of the purposes of a bar graph is to show relationships between data that are unconnected to each other.
2. Why should you choose a bar chart?
If you have a piece of information or data you need to compare by creating a chart, then use a bar chart. A bar graph can make the data easy to understand and interpret. This way, you can see what is highest and lowest on your data.
3. Are bar charts good for data visualization?
Absolutely, yes. There are many chart types for visualization. Based on the research, a bar graph is one of the most effective tools. It is fast to create, shows a comparison in a simple way, and is also easy for the viewers to understand.
Conclusion
After reading this guidepost, it would be easy for you to make a bar graph. Also, if you want a straightforward bar graph making method, use MindOnMap. This online bar graph maker makes your bar graph easy to understand and yet unique.