What is A Bar Graph [Including Types and Method]
Do you want a graphical representation to compare and contrast data, frequencies, measures, and more? Then, a bar graph is the best tool. The bar graph can help you see all the data most understandably. Also, it helps you organize all the information in a graph. Moreover, don't lose hope if you don’t know enough about the bar graph. The guidepost will provide all the detailed information regarding the bar graph. Also, you will discover its various types and its benefits. In addition, the post will give you simple tutorials on how to create a bar graph efficiently.

- Part 1. Definition of Bar Graph
- Part 2. Types of Bar Types
- Part 3. Benefits of Bar Charts
- Part 4. How to Make A Bar Graph
- Part 5. FAQs about Bar Graph
Part 1. Definition of Bar Graph
The bar graph is a pictorial representation of a group of data. You can view the graph as a horizontal or vertical rectangular bar. You can also see that the length of the bars is proportional to the data’s measure. A bar graph is also known as a bar chart. This type of chart/graph is one of the data management methods in statistics. Moreover, the variable quantity is shown on one of the axes, and the drawn bars are all the same width. Additionally, the other axes show the variable's measure. The bars show how a variable has distinct values or, more often, the distinct values themselves. The scale refers to the number of values on the y-axis of a column graph or the x-axis of a bar graph. These graphs are also used to compare different numbers. It is because the heights or lengths of the bars represent the variable's value. Bar charts simplify grasping the data and show frequency distribution tables. It can ease calculations effectively and clearly.
Part 2. Types of Bar Types
After knowing the definition of a bar graph, you can learn its various types and use them depending on the data you are dealing with. See below the types of bar graphs.
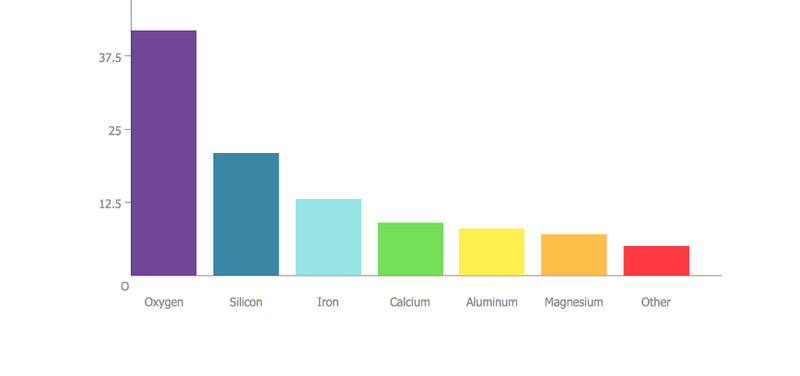
Vertical Bar Chart
A vertical chart might be useful when grouping data in a vertical form. Vertical bar graphs are sometimes referred to as column graphs. It also considered a vertical bar chart and vertical bar diagrams. The bars show the data's measurement. The graph's y-axis is used to display the data, and the height of the bars indicates the values. The bars' width or height corresponds to the quantities they stand for. You often generate a vertical bar graph when you have data to contrast and compare.
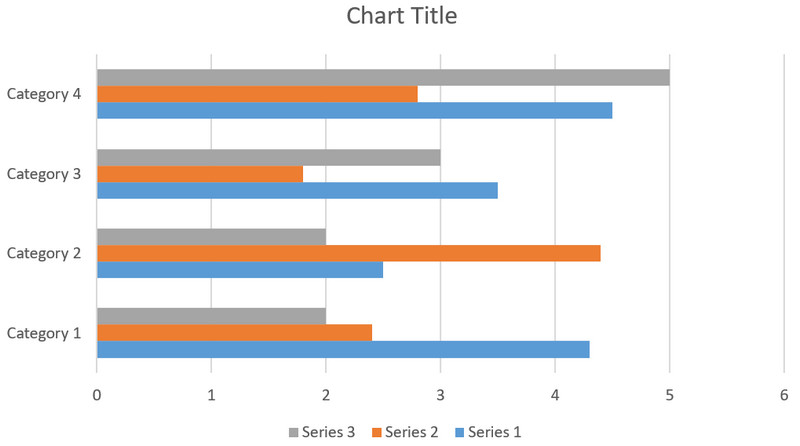
Horizontal Bar Chart
Horizontal Bar Chart
Horizontal bar charts represent the data horizontally. It is a graph/chart whose bars are drawn in a horizontal form. The information categories are shown on the vertical axis. Then, the data values are on the horizontal axis. Each bar's length equals the value corresponding to the data category. Also, all bars go across from left to right.
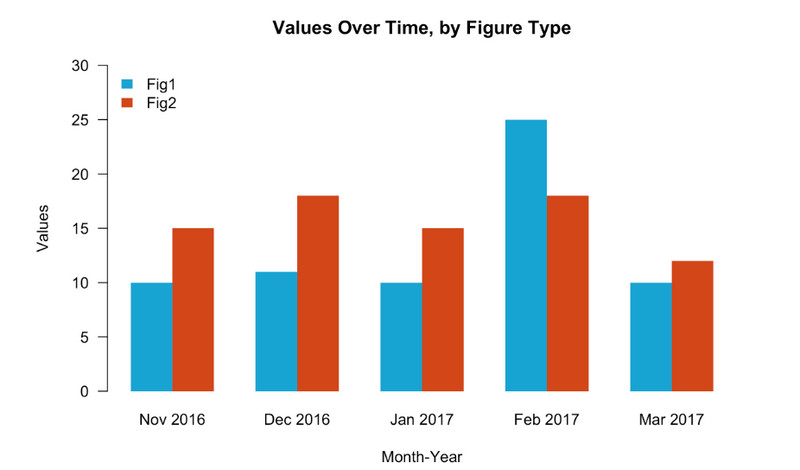
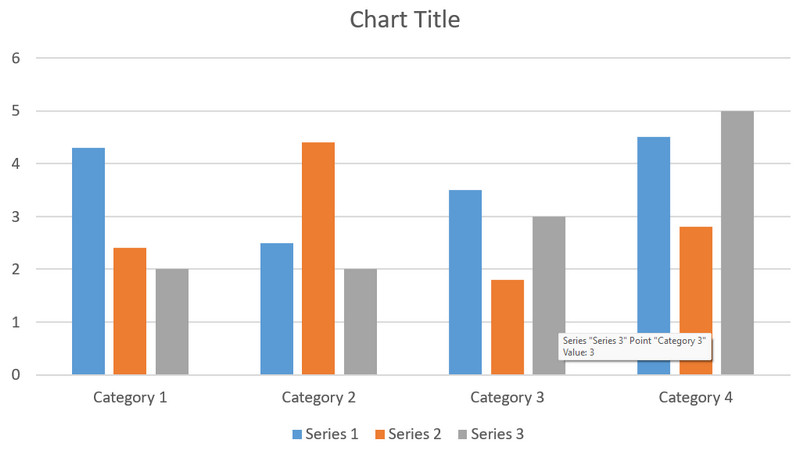
Grouped Bar Graph
The clustered bar graph is another name for the grouped bar graph. It displays the discrete value for many objects belonging to the same category. It aggregated the whole number of occurrences into one bar in this bar chart style. A grouped bar graph is a particular bar graph in which various data items are contrasted. Here, a single hue represents the distinct series throughout the set. You can use horizontal and vertical bar charts for a grouped bar graph.
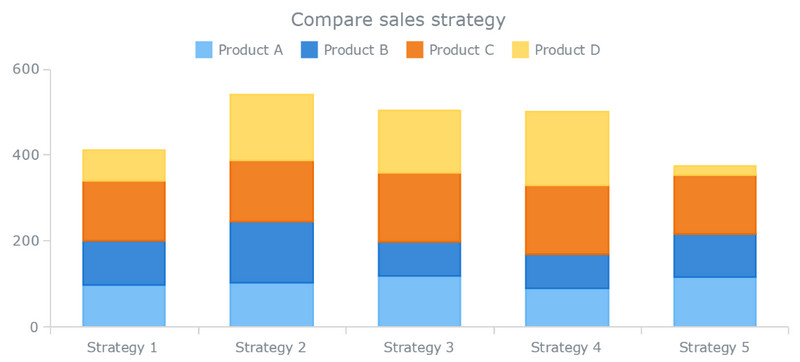
Stacked Bar Graph
The stacked bar graph is also known as a composite bar chart. It divides the total into various parts. Each part can be represented using various colors in this type of graph. It helps to differentiate the different categories. The stacked bar graph requires specific labeling to show the various parts of the bar. In a stacked bar graph, every bar represents the whole. Then every segment represents the different parts of the whole. A stacked chart is a bar chart showing the comparison and composition of a few variables. It is either absolute or relative. Stacked charts are an excellent tool for comparisons when used. Its purpose is to compare the total values of categories. Yet, stacked charts have a very narrow set of uses. With their limitations, they could be better in only a few situations. But when the requirements are met, they can be an excellent tool and method of presentation. They can help present a population information or story of sales.
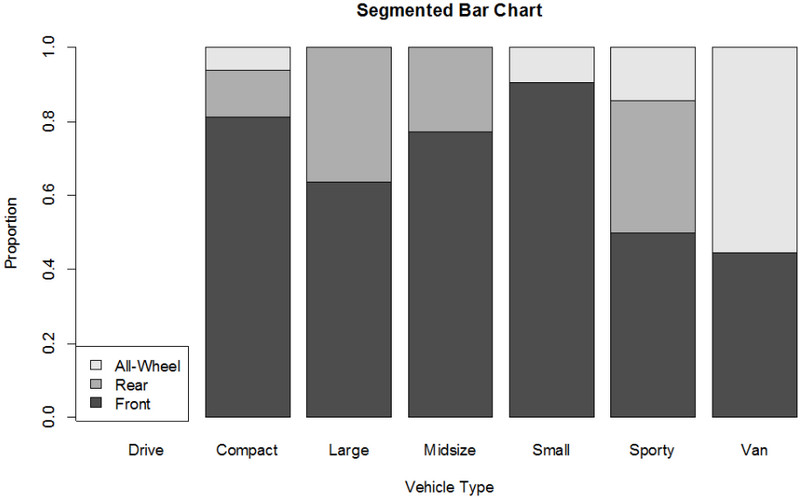
Segmented Bar Graph
The segmented bar graph is a bar graph with many bars split into segments. They are used to compare the exact data for other groups. Segmented bar graphs make it simple for users to see patterns, and compare values and trends in data. It is by separating them into various segments. Based on the data analysis, the segmented bar graph is suitable for people who need to decide. The examples are managers or salespeople who need to know what's selling well. This way, they can adjust their inventory accordingly.
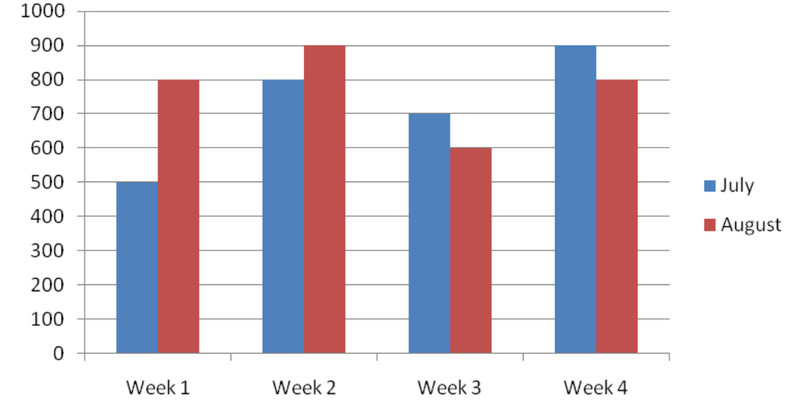
Double Bar Graph
A double-bar graph uses two parallel bars of varying heights to depict data. Bars can be placed vertically or horizontally. A double-bar graph helps contrast two data sets. The axes in a double bar graph are two. A double bar graph's x-axis displays the comparison categories. The scale is shown on the y-axis. A scale is a group of figures that depict data and are divided into equal intervals. It's crucial to understand that every double-bar graph needs to have a title. The double bar graph's title gives viewers a broad picture of what is being measured and compared.
Part 3. Benefits of Bar Charts
The bar chart is not just a visual representation of data. You can get various benefits while using this type of chart. See below the advantages of bar charts.
Easily Understood
A bar graph is a good choice when explaining your facts to big groups of people. It is because of how straightforward it is. You can easily comprehend the data on the chart by viewing it.
Representation Changes Over Time
A bar chart has the benefit of being able to display data that is changing over time. That makes different trends easier to see for both user and the reader. If there are changes in a particular situation, data, frequencies, etc., you can use bar charts to show them clearly.
Compare and Contrast Information Effectively
With the guide of a bar graph, you can compare and contrast data easily. This way, you will understand how a particular concept has similarities and differences with another concept. Also, you can understand their relationship with each other.
Data Interpretation
If you are confused about simplifying information, use a bar graph. This type of graph can help you understandably interpret the data. With the help of this graph, you won’t get confused again when the information is already organized and in a graph form.
Shows the Concept’s Value
Another benefit of using a bar chart is knowing the value of each concept, topic, or data. It will give you enough idea of the highest and the lowest data. The best example is getting a score on an exam. A bar chart lets you see who got the highest and lowest scores in an organized way. In this kind of situation, you can rely on a bar graph.
Part 4. How to Make A Bar Graph
In this part, you will learn the best method to make a bar graph using MindOnMap. This tool is perfect for organizing your data effectively and creatively. You can use rectangular shapes, lines, numbers, letters, and more in this tool. Also, you can use various themes and templates for the graph. In addition, you can put colors on the graph to make the data better and clear. Another feature you can encounter using the tool is the auto-saving feature. While in a bar-graphing process, the tool can save the bar graph automatically. Moreover, you can access MindOnMap on all website platforms. It is available on Google, Firefox, Explorer, and more. You can also use the tool on any device. It includes Windows, Mac, Android, and iPhone devices. Follow the simple tutorials below to create a bar graph.
Secure Download
Secure Download
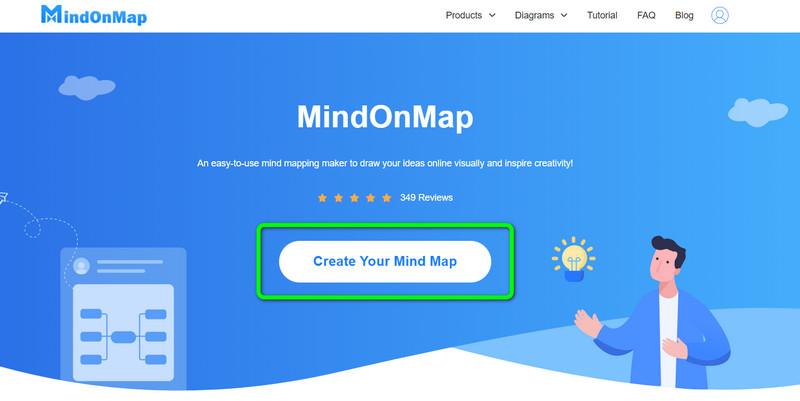
Visit the official website of MindOnMap. Then, click the Create Your Mind Map option to see the new web page.
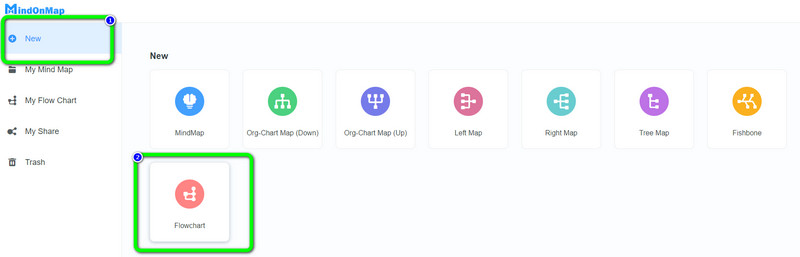
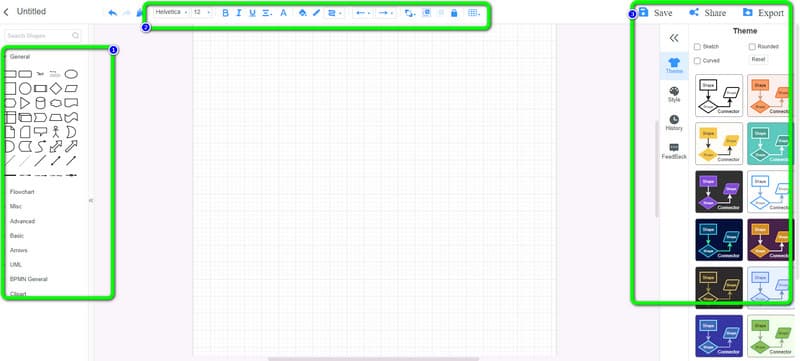
After that, click the New option and select the Flowchart icon. This way, you can see the tool’s main interface.
Use the shapes on the left interface to start creating a bar graph. Also, go to the right interface to use free themes and templates. To put color on the shapes, go to the Fill Color option.
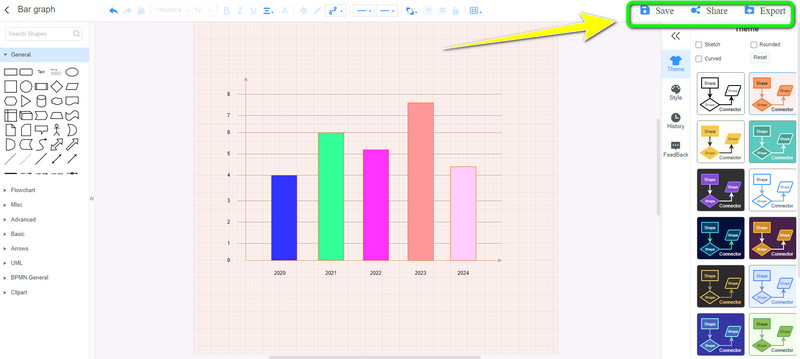
When you are done creating the bar graph, click the Save button. To export the bar graph in various formats, click the Export button. Also, click the Share option to get the link to your final output.
Further Reading
Part 5. FAQs about Bar Graph
1. When should you use a bar chart?
You can use and create a bar chart to see a distribution of data points. Also, compare metric values across different subgroups of the data. From a bar chart, you can see which groups are the most common or highest. You can see how other groups compare against the others.
2. Can I use Matplotlib for the bar chart?
Yes, you can. Matplotlib is a python module that allows you to create all charts, including the bar chart.
3. How can I generate a bar chart with percentages?
Based on further research, you can use Excel. Select the information to create a bar chart. Ensure that the information includes the percentage. Then, click the down arrow option to insert the bar chart option from the charts section. After that, select the preferred chart type. The bar chart will appear on the screen, including the percentage.
Conclusion
If you want to learn more about bar graphs, read this informative post. You can see its full definition and its various types. Aside from that, you will discover the easiest way to create a bar graph using MindOnMap. So, what are you waiting for? Use this online tool, and start creating your bar graph.