Venn Diagram Templates and Examples - Edit and Create One
A Venn Diagram is a two-way visual model of information many people use to compare and contrast things. John Venn invented Venn Diagram in 1980, and it is continually used up until today. In addition, a Venn Diagram consists of two overlapping circles, and a specific topic is represented in each circle. A typical Venn Diagram is a clear circle, but sometimes, teachers put bullets inside them so their students can quickly grasp their topics or lessons. Venn Diagrams may be presented in many forms. And in this article, we will show you the best Venn Diagram templates you can set as an example. You will also learn the best tool to create a Venn Diagram.

- Part 1. Recommendation: Online Diagram Maker
- Part 2. Venn Diagram Templates
- Part 3. Venn Diagram Examples
- Part 4. FAQs about Venn Diagram Templates and Examples
Part 1. Recommendation: Online Diagram Maker
Many tools appear on the result page when you search for a Venn Diagram maker on your browser. And in this section, we will present you with the most outstanding Venn Diagram maker online. Read this section comprehensively to learn how to create a Venn Diagram for free.
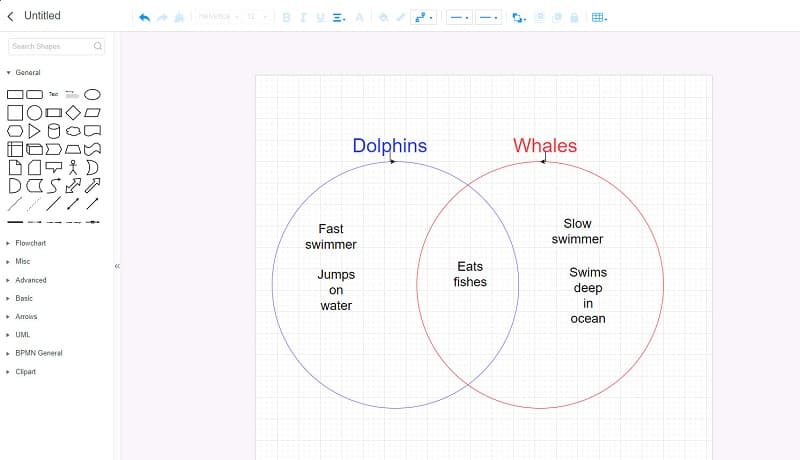
MindOnMap is an online diagram maker that you can use for creating fantastic Venn Diagrams. You can access free online software on all web browsers, such as Google, Firefox, and Safari. MindOnMap is usually for creating mind maps for organizing thoughts, but you can create a Venn Diagram with this tool. Additionally, when you create a Venn Diagram on MindOnMap, you just use the shapes to create your diagram. You can also easily add text to your diagrams because it has easy-to-locate functions. Also, it has tons of ready-made templates that you can use for mind mapping and more.
Furthermore, many people like this online tool because you can use unique icons so that you can personalize your mind maps. You can also insert images, links, and texts as you need. MindOnMap is truly an explicit tool for creating diagrams. Therefore, if you want to use it, follow the simple guide below. What’s even excellent about this tool is that you can export it in different formats, like PNG, JPEG, SVG, PDF, etc. You can export your project to various platforms or save it on your device.
Secure Download
Secure Download
Part 2. Venn Diagram Templates
It is easier to create a Venn Diagram if you have a ready-made template. But if you do not have one, you can always search on your browser for the best Venn Diagram templates. And to save you some time, we searched for the best Venn Diagram templates you can use to create stunning Venn Diagrams Without further ado, here are the top five impressive Venn Diagram templates you can set as an example.
Venn Diagram PowerPoint Template
PowerPoint is not just an application for creating powerful presentations. Do you know that you can also use Microsoft PowerPoint for creating Venn Diagrams? Yes, you read that right! To activate the Venn Diagram, go to the Insert tab and click the SmartArt menu. Moreover, PowerPoint is also easy to use for creating Venn Diagrams. However, the Venn Diagram looks simple and not presentable; you can still modify them to make them explicit. Below are some of the most amazing Venn Diagram PowerPoint templates you can copy.
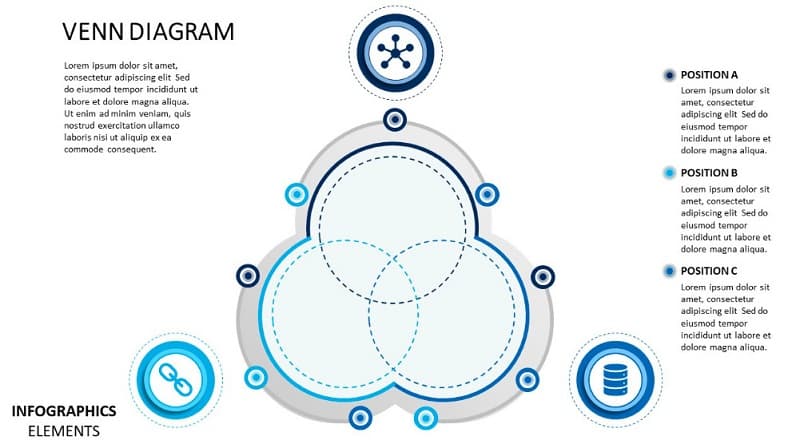
Venn Diagram Material Design for PowerPoint
This Venn Diagram PowerPoint template presents an excellent cycle design that shows three overlapping stages. This template is a three-step PowerPoint diagram that displays the complex Venn diagram relationships. Furthermore, it is a perfect template for organizing thoughts or ideas and a brainstorming tool for business and educational purposes. The three circles are for the three segments where you will put the contents of your topic. This Venn Diagram template is suitable for discussing three objects' relationship. In addition, the shapes and icons of the Venn Diagram Material Design are editable so that you can personalize the design.
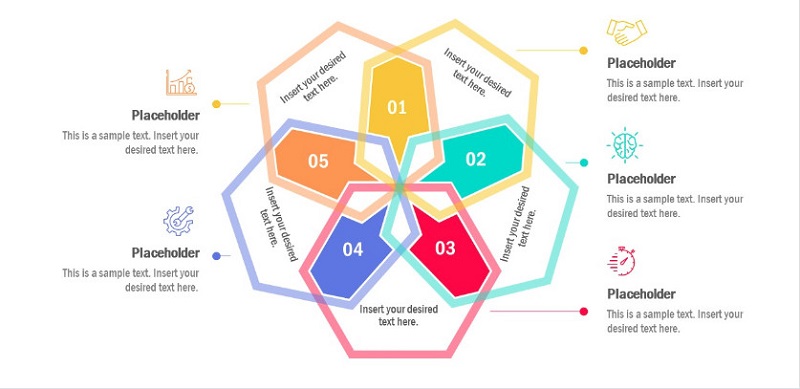
5 Hexagon Venn Diagram Template for PowerPoint
5 Hexagon Venn Diagram PowerPoint is a Venn Diagram template to present an infographic presentation of overlapping processes. You will see five hexagons conjoining two shapes from both sides. You will also observe different colors for each shape. Moreover, if you want to create an organized format of the Venn Diagram, this template will help you with that because this template has text placeholders and number sequences. The 5 Hexagonal Venn Diagram Template for PowerPoint indicates a logical relationship between two or more variables and organizing methods for complex relationships of your topics.
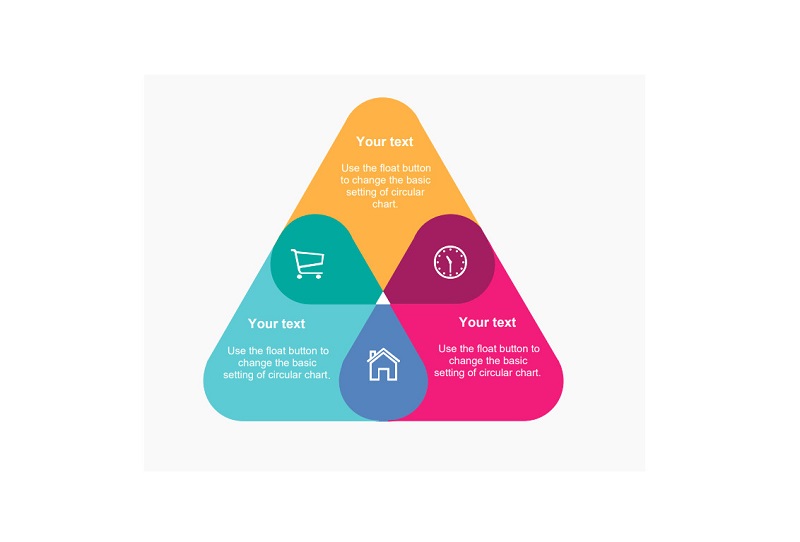
Triangle Venn Diagram
Triangle Venn Diagram is another Venn Diagram PowerPoint template you can use for infographic PowerPoint.This Venn Diagram has three interconnected triangle segments that present different topics in a professional or casual presentation. The appealing style of this Venn Diagram can show the relationships of the three groups you are presenting. Also, the overlapping part of the triangles, which have different colors from the triangles with a more significant portion, represents the clipart icons that you can change.
Venn Diagram Template Google Docs
Have you ever wondered if you could create a Venn Diagram using Google Docs? Luckily, Google Docs is a software where you can create a Venn Diagram for your writing. By going to the Insert option at the top of the interface, click the Drawing option and create a Venn Diagram there. Then, you will see the functions you can use to create a Venn Diagram on Google Docs. By using the Shapes, you can create a fantastic Venn Diagram. Here is an example of a simple Venn Diagram template for Google Docs that you can use as a reference.
Triple Venn Diagram Template
Using a triple Venn Diagram is a great way of visualizing data because it can improve your understanding of how different the groups of data you are inputting in your diagram. Also, triple Venn Diagrams can be used for creating charts and graphs. Here are the triple Venn Diagram templates that you can do.
Sustainable Development Venn Diagram Template
Sustainable Development Venn Diagram Template is an example of a triple Venn Diagram template for creating comparison and contrast of Natural Environment, Economy, and Society topics. These three topics are the three main pillars of sustainable development. Additionally, the idea of this diagram is what can be achieved if we conduct economic development to protect the environment while supporting the community's well-being.

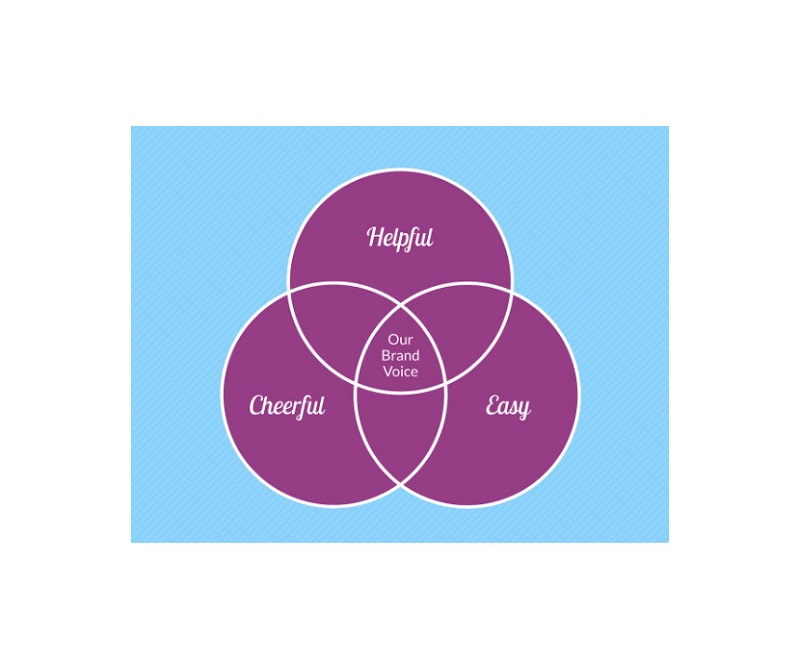
Brand Voice Venn Diagram Template
Nowadays, social media is a great platform for marketing strategies. Many businesses use social media to promote and endorse their products, brands, or services. For that reason, this template has become an important Venn Diagram template. With this template, your potential buyers can identify the characteristics of your brand. Use this template if you want to promote your business or your brand to different social media platforms.
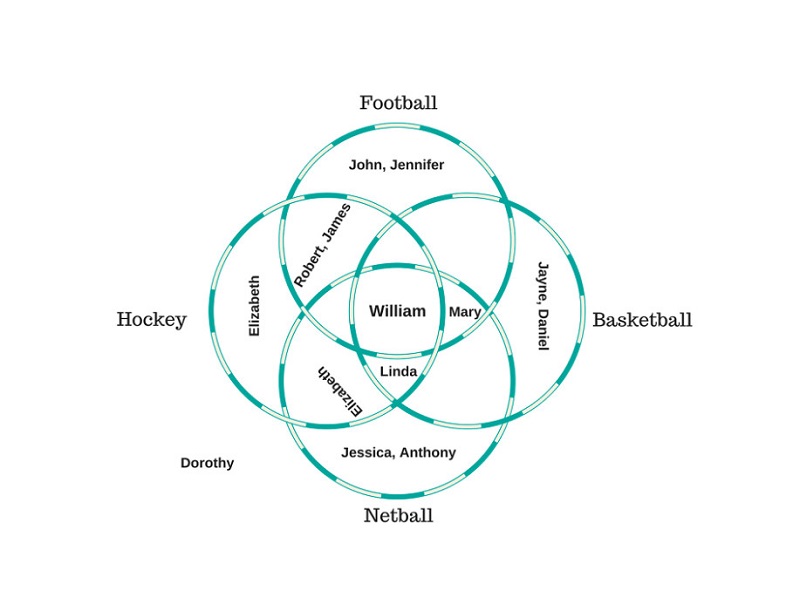
4 Circle Venn Diagram
A 4 Circle Venn Diagram focuses on the relationships between four components or concepts. For example, a set of students were asked about which sports they played in school. The four sports options are Football, Volleyball, Basketball, and Badminton. To show the data of the sets, you must use a four-circle Venn Diagram.
Part 3. Venn Diagram Examples
Here are some Venn diagram examples so you can have more ideas on how to create one. The following examples are some ideas of the Venn Diagram.
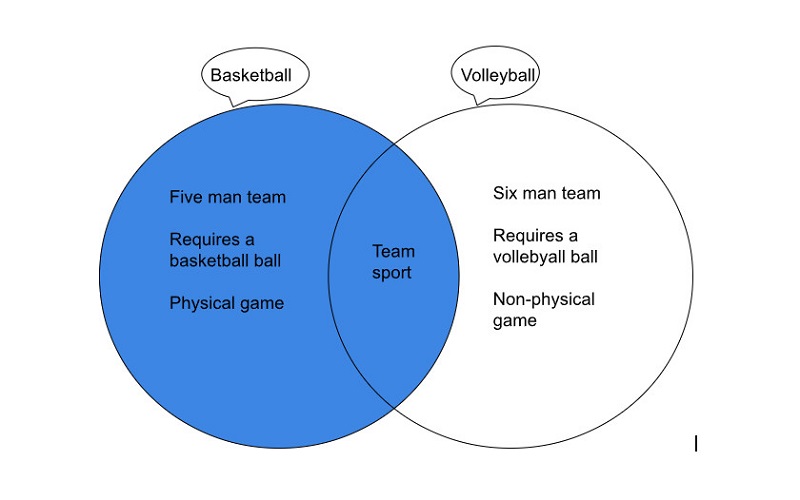
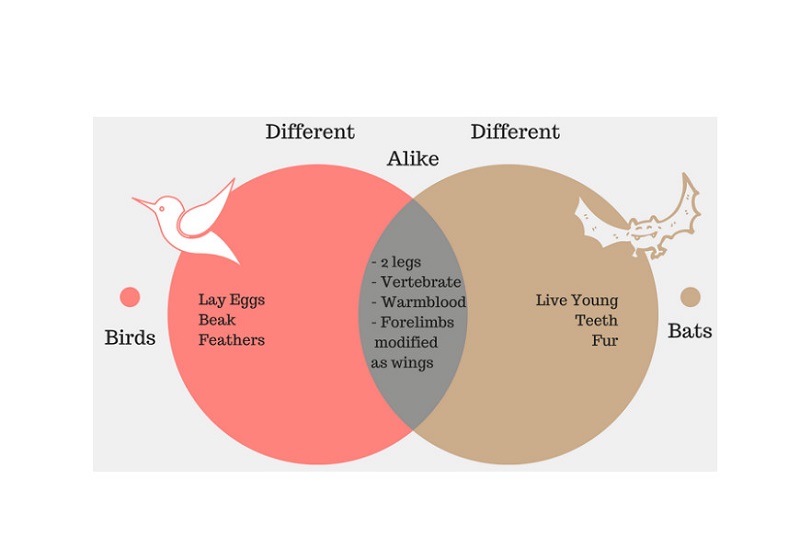
Compare and Contrast Venn Diagram Example
Most of the time, people use a Venn Diagram for comparing and contrasting objects. The comparative characteristics of the topics are inserted on the larger portion of the circle. In contrast, similar characteristics are inserted on the small portion of the circle or the middle part. Here is a compare and contrast Venn Diagram example.
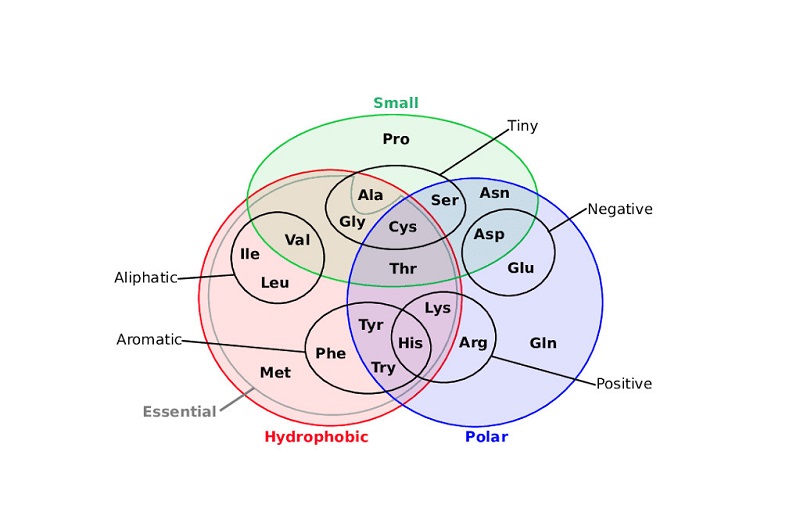
Science Venn Diagram
Scientists also use Venn Diagrams to study human health, medicines, and other science-related studies. And in the example below, you will see a comparison of the amino acids important to human life.
4 Circle Venn Diagram
A 4 Circle Venn Diagram focuses on the relationships between four components or concepts. For example, a set of students were asked about which sports they played in school. The four sports options are Football, Volleyball, Basketball, and Badminton. To show the data of the sets, you must use a four-circle Venn Diagram.
Further Reading
Part 4. FAQs about Venn Diagram Templates and Examples
Is there a Venn Diagram template in Word?
Yes. Click the Insert tab, and on the Illustration group, click the SmartArt. Then, on the Choose a SmartArt Graphic gallery, select Relationship, click the Venn Diagram layout and click OK.
Can I create a Venn Diagram in Excel?
Yes. You can create a Venn Diagram in Microsoft Excel. Go to the Insert tab and click the SmartArt button on the Illustration groups. And then, on the SmartArt graphic window, choose Basic Venn, and click the OK button.
What does A ∩ B mean?
The meaning of that symbol is A intersection B or the intersection of A and B.
Conclusion
Presented above are the Venn Diagram templates and examples you can take as your reference so that you will have an idea of how to create one. And if you do not know which tool to use, we recommend the top-notching application for creating Venn Diagrams, MindOnMap.