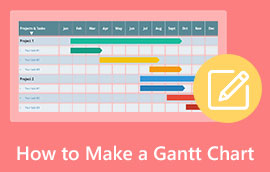
How to Make A Gantt Chart in Google Sheets with Detailed Steps
The Gantt chart belongs to the best chart to break down project schedules into tasks or events with time. This article is helpful if you also want to create your Gantt chart for arranging your schedule, projects, tasks, and more. This post will teach you the most effective procedures about how to make a Gantt chart using Google Sheets. In addition, you will discover the pros and cons of the online tool when creating your chart. Moreover, the post will also offer you the most excellent alternative for Google Sheets. This way, you will have another option and tool when creating your chart. So, if you want to discover all the methods and tools, read this post right now.

- Part 1. What is Google Sheets
- Part 2. Pros and Cons of Using Google Sheets to Build Gantt Charts
- Part 3. How to Make A Gantt Chart in Google Sheets
- Part 4. Bonus: Alternative Way to Create Gantt Charts in Google Sheets
- Part 5. FAQs about Making a Gantt Chart in Google Sheets
Part 1. What is Google Sheets
Users can create, edit, and modify spreadsheets using the web tool known as Google Sheets. Additionally, it instantly distributes the data online. The Google product has capabilities that are common to spreadsheets. Rows and columns can be added, removed, and sorted. But, compared to other tools, it enables many scattered users to work together. It is with the use of a spreadsheet at once and interacts using an integrated instant messaging program. Spreadsheets can be immediately uploaded by users from their computers or mobile devices. Users can see other users' modifications while they are being made. Also, the Gantt chart maker saves all changes automatically. Furthermore, with the help of this online tool, you can organize all your data. It means that creating a chart from this tool is possible.
Part 2. Pros and Cons of Using Google Sheets to Build Gantt Chart
In this part, you will learn all the advantages and disadvantages of Google Sheets when creating a Gantt chart. You need to know this part, primarily if you use Google Sheets to make your chart. See the pros and cons below.
PROS
- If you are familiar with Microsoft Excel, this tool will become easier for you.
- You can share your Gantt chart with other people.
- You can use this online tool without purchasing a subscription plan.
CONS
- Google Sheets is not perfect for complex subjects.
- There are times when it becomes frustrating for multiple members to collaborate.
- You cannot add a milestone when creating a Gantt chart in Google Sheets.
- Google Sheets are one-dimensional.
Part 3. How to Make A Gantt Chart in Google Sheets
You can follow the steps below if you want to create a Gantt chart using Google Sheets. Make sure that you are done creating your Gmail account.
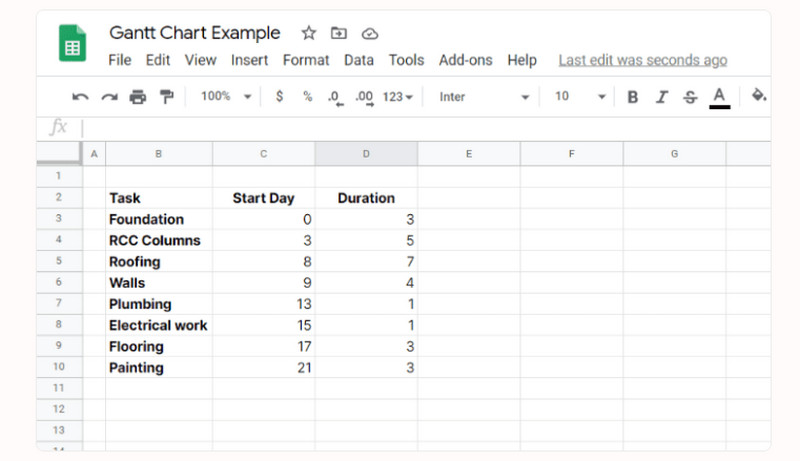
The first step is to navigate your browser on Google Sheets. You can find this on the Google Drive homepage. Then, you must prepare all the data you need for your Gantt chart. In this sample, you should create three columns: Tasks, Start Day, and Duration. Since the column is provided on the sheet, you can just insert the word Tasks, Start Day, and Duration. Tasks are the activities you will see on the chart. Start Day is the day on which activities start on the timeline. Lastly, the Duration. It is the duration of days you need to complete the tasks.
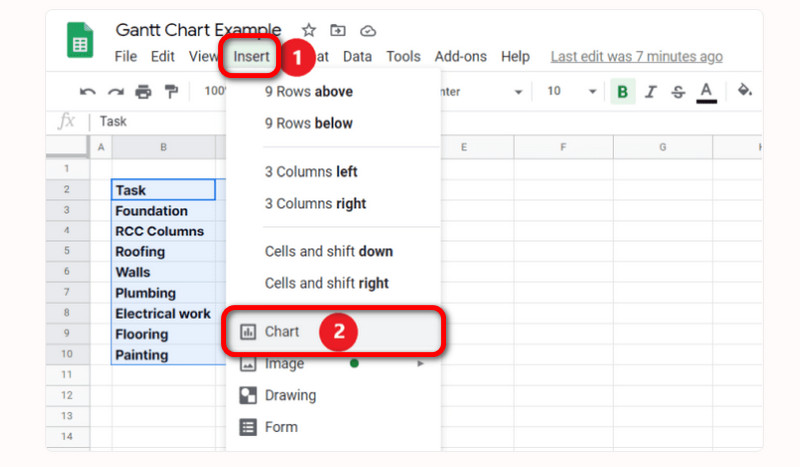
Since Google Sheets don’t offer a Gantt chart template, you will use the stacked bar chart. Select the data and navigate to the Insert > Chart option. It will automatically input a stacked bar chart.
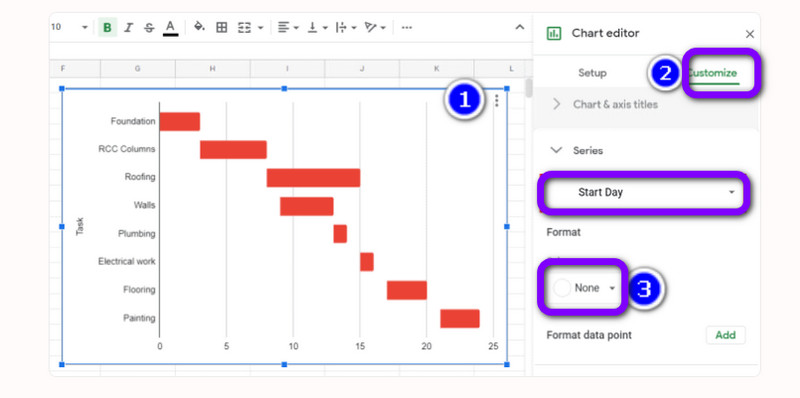
You need to format the stacked bar to become like a Gantt chart. Change the color of the Start Day from default blue to none. Select the chart by clicking it. Navigate to the three dots in the upper right corner, and click Edit chart. Then, Chart editor > Customize > Series and select Start Day. Lastly, go to Format > Color to none. After that, the chart is ready. You also can use Google Sheets to create Org charts.
Part 4. Bonus: Alternative Way to Create Gantt Charts in Google Sheets
If you prefer an easier way to create a Gantt chart, use MindOnMap. This online tool can help you to create your Gantt chart in a simple way. It also offers ready-to-made templates, making it more convenient for all users. In addition, you can make your chart more attractive by changing the font color, style, and sizes. MindOnMap is accessible in all browsers. It includes Google, Edge, Safari, Firefox, and more. Moreover, you can use this tool for free. Also, when doing a Gantt chart, you can change the color of each milestone to make it colorful and easy to see. You can follow the simple steps below to make a Gantt chart using MindOnMap.
Open your browser and visit the official website of MindOnMap. Then, click the Create Online button. Or click the Free Download button below to use this program directly.
Secure Download
Secure Download

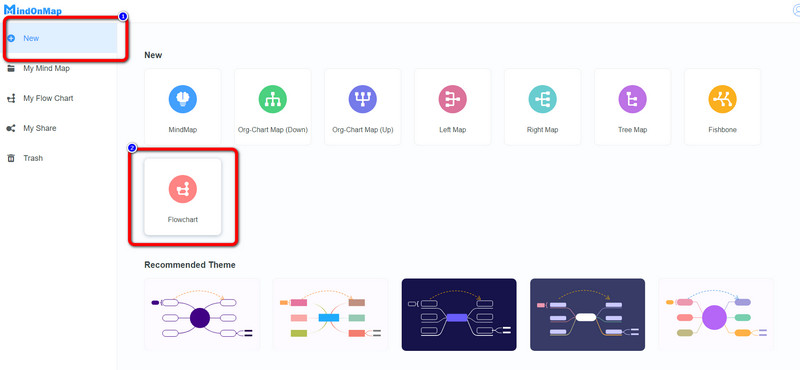
After that, click the New button. Then, select the Flowchart option to create a Gantt chart.
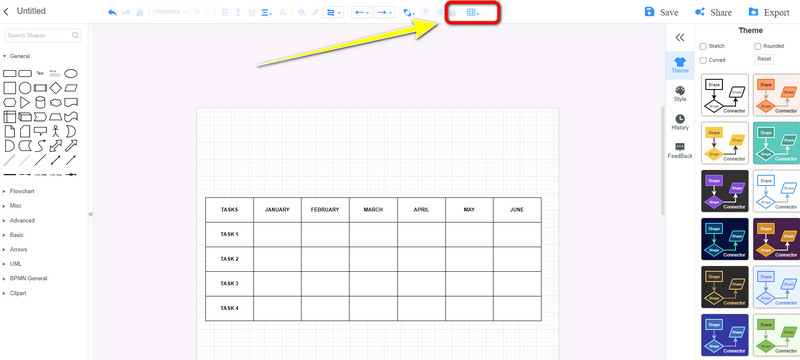
To start creating your chart, you have to insert a table. Click the Table icon on the upper part of the interface. After that, when the table is already on the screen, double-click the box to insert text.
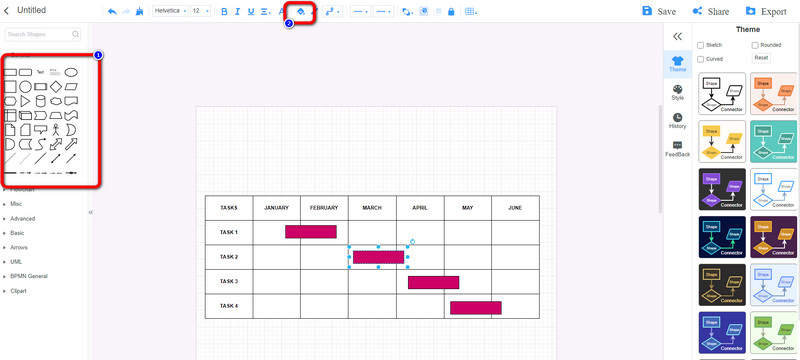
You can also add a milestone to your chart. Go to the Shapes section and select the rectangle shape. Navigate to the Fill color option on the upper interface to change the color of the milestone.
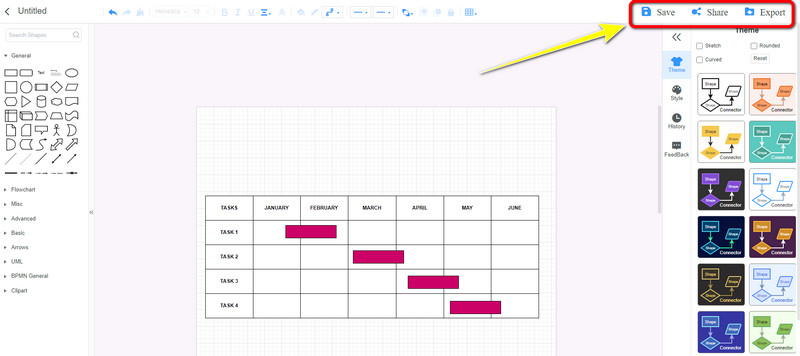
When done creating the chart, click the Save button to save it on your MindOnMap account. If you plan to share your chart, go to the Share option and copy the link. You can also click the Export button to export your Gantt chart into various formats like JPG, PNG, SVG, DOC, PDF, and more.
Part 5. FAQs about Making a Gantt Chart in Google Sheets
What is a Gantt chart used for?
There are three reasons. To manage and build a comprehensive project, determine task and logistics dependencies, and monitor the progress of a project.
What are the disadvantages of Gantt charts?
The disadvantage of Gantt charts is opportunity cost, wherein you have to spend more time on your product. The time when you need to update your chart and make some changes. These are some of the disadvantages of Gantt charts.
What are the benefits of using a Gantt chart?
You can determine all the tasks and think about the project plan. Also, you can identify all the tasks you need to complete and determine the dependencies.
Conclusion
These are the best methods you can learn on how to make a Gantt chart in Google Sheets. Also, you discovered the best alternatives for Google Sheets in creating a Gantt Chart. However, you can’t add milestones to your chart when using Google Sheets. So, if you want to create your chart with complete elements, use MindOnMap.