How to Make A Data Flow Diagram Using Online and Offline Tools
Understanding the data flow in an organization's information system is crucial and essential. A data flow diagram demonstrates how information moves through a process or system. Data inputs, outputs, storage, and flows are all represented using standardized symbols and terminology in data flow diagrams. Data flow diagrams are divided into two: logical and physical flow diagrams. The system's data flow implementation is shown in the physical data flow diagram. The logical data flow diagram explains what occurs as specific business operations occur. In this guidepost, you will learn how to create a data flow diagram in Word and using an online tool. To find out more regarding this discussion, read this whole article.

- Part 1: Easiest Way to Create A Data Flow Diagram
- Part 2: How to Make a Data Flow Diagram on Microsoft Word 2010
- Part 3: FAQs about Creating A Data Flow Diagram
Part 1: Easiest Way to Create A Data Flow Diagram
One of the most data flow diagram makers you can use is MindOnMap. This online software has the capability of creating an understandable data flow diagram. It has the tools you need, such as arrows, shapes, and lines that serve as connectors, text, styles, and more. Also, it has numerous templates you can use. In addition, you can make an attractive diagram flow because it also has free themes you can try. This way, your diagram will become more stylish yet easy to understand. You can also create multiple diagrams here in this software, unlike other applications requiring a subscription for creating unlimited diagrams. But here, you can utilize it for free.
The significant part of MindOnMap is that you can save your data flow diagram automatically, which is convenient because you won’t need to worry about losing your output accidentally. Also, you can export your diagram in various formats, such as PDF, SVG, PNG, JPG, etc. This way, you can choose any format you prefer when saving your work on your device. Another way of saving your diagram is to save it on your MindOnMap account for long-time preservation. But wait, there’s more. You can also share your diagram with your colleagues by sharing the link of your diagram from your account. This way, you can share ideas and brainstorm with them.
Furthermore, MindOnMap is not just a data flow diagram maker. You can create various maps, diagrams, and illustrations from this software, such as organizational charts, empathy maps, knowledge maps, affinity diagrams, program flow, and more. With all these features, you can tell that MindOnMap is the right choice for creating maps, diagrams, and more. You can use the simple guide below to create your data flow diagram using MindOnMap.
Secure Download
Secure Download
Visit the Official website of MindOnMap. Then, create your account by clicking the Create Your Mind Map button. You can connect your email account here to create a MindOnMap account easily.

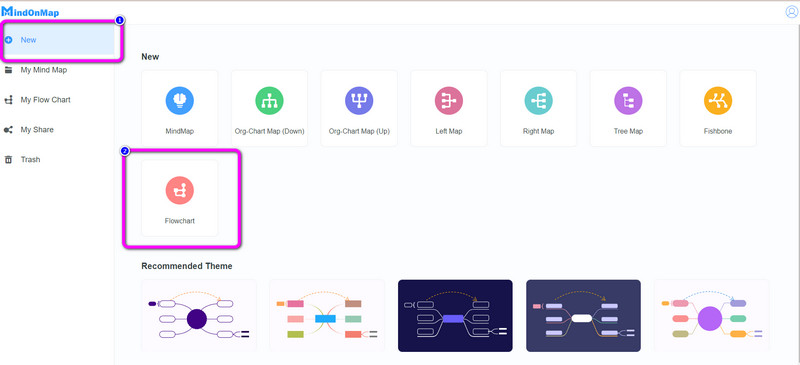
After creating an account, the website will automatically put you on the main page of MindOnMap. Then, select the New option and click the Flowchart symbol.
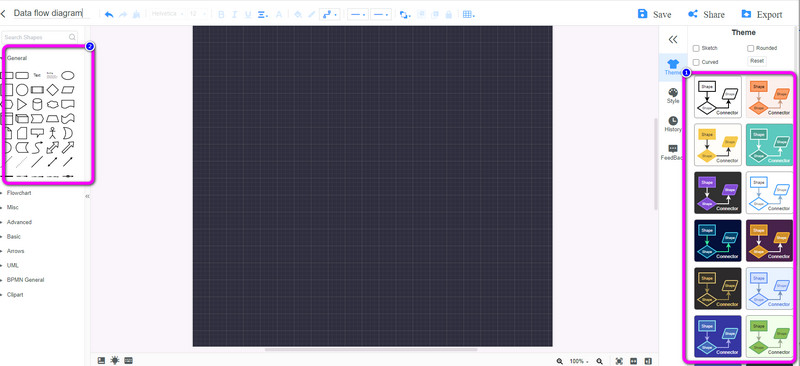
To start creating your diagram, go to the right part of the interface to choose your desired theme. Then, go to the left part to insert shapes, text, and arrows.
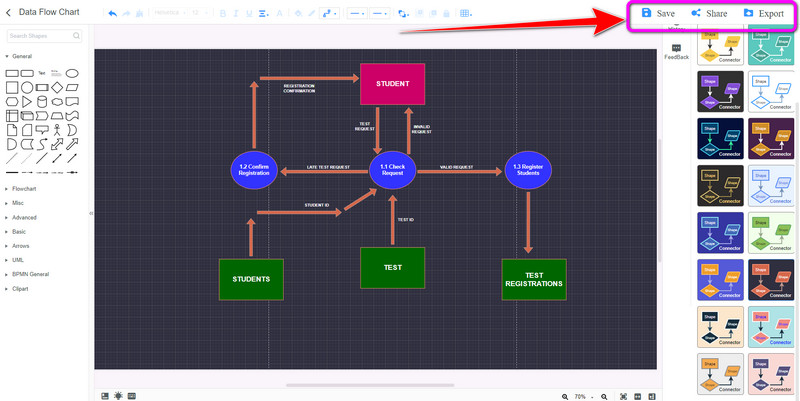
If you are done creating your data flow diagram, you can keep it on your account by clicking the Save button. To copy the link of your diagram, click the Share button. Lastly, click the Export button to save your diagram in different formats, such as SVG, PDF, PNG, and JPG.
Part 2: How to Make Data Flow Diagram on Microsoft Word 2010
Do you want to create a data flow diagram using downloadable software? You can use Microsoft Word. This tool makes creating a diagram easy because it provides various elements like shapes, lines, arrows, text, designs, and more. In addition, Microsoft Word offers more features than creating a data flow diagram. You can easily use this offline tool to keep your research, make a simple letter, outline, plan, and more. You can also create various maps, presentations, illustrations, and diagrams, such as organizational charts, numerous flowcharts, knowledge maps, and different thinking maps. Utilizing this data flow diagram maker is simple because it has an understandable interface with easy procedures, which is suitable for professional and non-professional users. You can also access this application on both Windows and Mac to use it conveniently.
However, Microsoft Word doesn’t offer data flow diagram examples or templates. If you want to create your diagram here, you will start from scratch, which is time-consuming. Also, you need to purchase the application to utilize it. But purchasing a plan is costly. In addition to that, the installation process has complicated procedures, making it confusing to users. Use the complete guides below to learn how to create a data flow diagram in Word 2010.
Go to your browser and look for Microsoft Word. Then, install the application on your Windows or Mac after purchasing it.
Select the Blank Document to create your data flow diagram after launching the application.
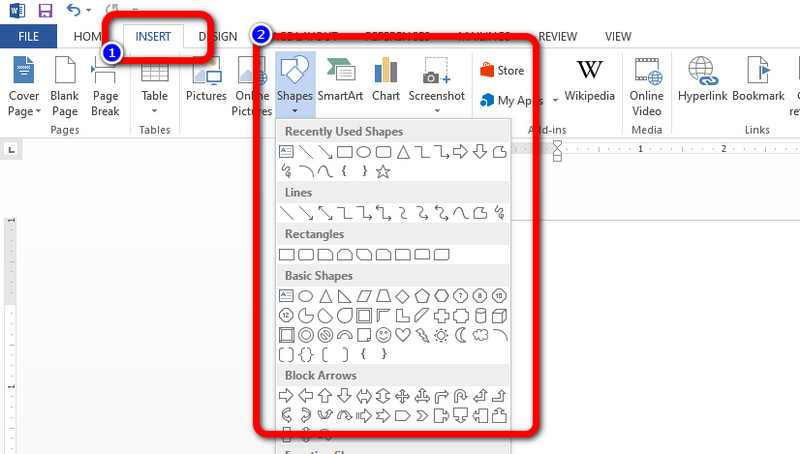
When you are on the main interface, go to the Insert option on the upper part of the interface. Then, click the Shapes icon to choose the shapes you want to use.
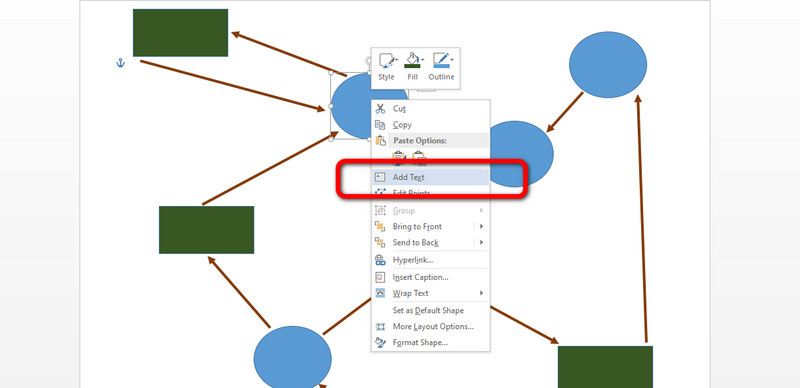
After inserting shapes and arrows on the diagram, right-click the shapes using your mouse. Then, select the Add Text option to insert text inside the shapes.
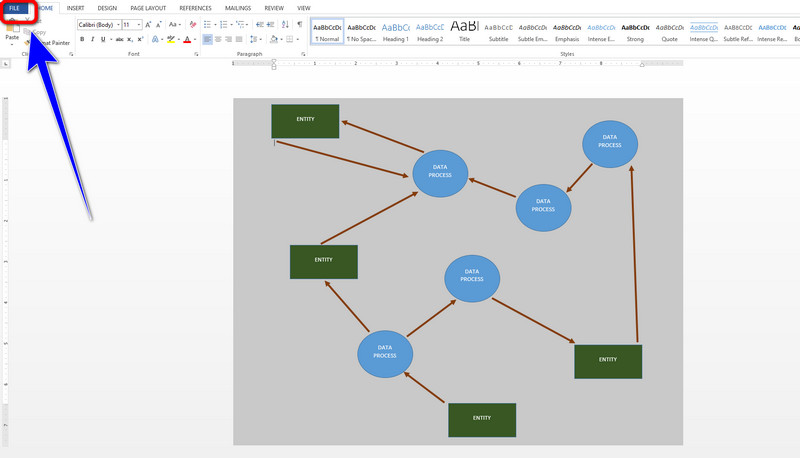
Navigate to the File option on the left upper of the interface. Then, select the Save as button and save the data flow diagram on your desired file location.
Part 3: FAQs about Creating A Data Flow Diagram
1. How to make a data flow diagram in Excel?
Download Microsoft Excel on your Windows or Mac. Open a blank document and proceed to the Insert tab and locate the Shapes icon. After that, use these shapes to create your diagram. Shapes include arrows or connectors. Then, to insert the information inside the shapes, right-click the shapes and select Add Text option. If you want to change the shape color, go to Format options on the upper part of the interface. Afterward, when you are satisfied with your data flow diagram, go to the File tab and click Save as button to keep your diagram.
2. What is the difference between a flowchart and a data flow diagram?
The distinction between a data flow diagram and a flowchart is substantial. The flowchart shows how to program modules' control flows. Data flow diagrams show how the data moves through a system at different levels. Control or branch elements are absent from data flow diagrams.
3. What are the levels in the data flow diagram?
The level of the data flow diagram is 0,1 and 2. The 0-level diagram is also known as a context diagram. It is intended to be an abstract view that presents the system as a lone process with connections to outside entities. It depicts the complete system as a single bubble with incoming/outgoing arrows designating input and output data. The context diagram is divided into many bubbles and processes in a 1-level diagram. And lastly, the 2-level data flow diagram. Parts of 1-level DFD are further explored in 2-level DFD. You can use it to plan or keep track of precise or essential information about the system's work.
Conclusion
The ways mentioned above are the best option that you can have. These methods teach you how to create a data flow diagram. But in Microsoft Word, you can use no free template, so you need to create your template, which is time-consuming. If you want an accessible data flow diagram template, you can use MindOnMap.