Step-by-step Tutorial about How to Make A Pie Chart in Excel
Do you have a Microsoft Excel program on your computer and want to create a pie chart? Worry no more. This guidepost will give you the best tutorials on how to make a pie chart in Excel. We will give you the solutions you want for creating a chart. In addition, besides Excel, you will also discover the best alternative software. This way, you will have another option on what pie chart maker you want to use. So, without anything else, let’s proceed to the discussion and learn all the methods you can get.

- Part 1. How to Create A Pie Chart Using Microsoft Excel
- Part 2. How to Insert A Pie Chart in Excel
- Part 3. Best Alternative Way of Using Excel to Do A Pie Chart
- Part 4. FAQs about How to Make A Pie Chart in Excel
Part 1. How to Create A Pie Chart Using Microsoft Excel
Microsoft Excel is reliable when creating a pie chart. It is not just a table full of boxes. If necessary, it can also produce a pie chart. This offline tool lets you quickly and easily sort or arrange the data. The first step in making a chart is to organize and input all the information/data. After that, you can proceed on creating your pie chart. You can also use various tools to build a chart. Shapes, font types, colors, percentage symbols, and numbers are acceptable. There is another way to make the pie chart, though, if you don't want to use these tools. You can use a pie chart template from Microsoft Excel. With this template, you can lessen the work when creating the chart. After utilizing it, you can input all the information you wish to include on the template. Adding a percentage marker is also an option if the chart is about computing data. Also, Excel is accessible on both Mac and Windows.
Unfortunately, Microsoft Excel does have drawbacks. When utilizing the free version, all functions are accessible. If you haven't yet entered the data in the spreadsheet, the free template won't appear either. You need to be aware of this kind of situation. The cost of Microsoft Excel is high. To use all the features, you must purchase a subscription plan. Also, you need to consider the storage space of your computer. Excel consumes storage space on your device. So, the offline program won't work well if you have small storage. See the steps below to learn how to create a pie chart in Excel.
Download and install Microsoft Excel on your computer. When the installation process is done, run the program on the computer.
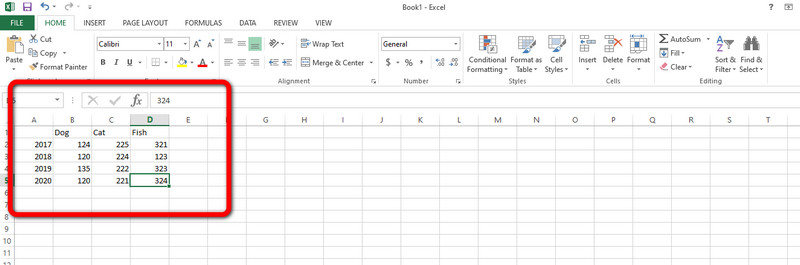
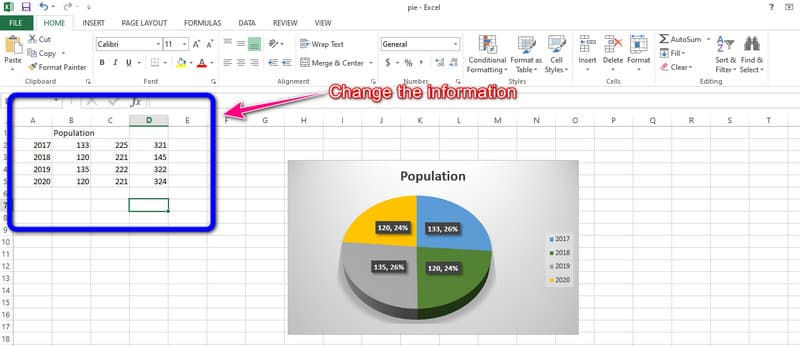
Insert all the information on the spreadsheet. You can put the label first, then include all the data.
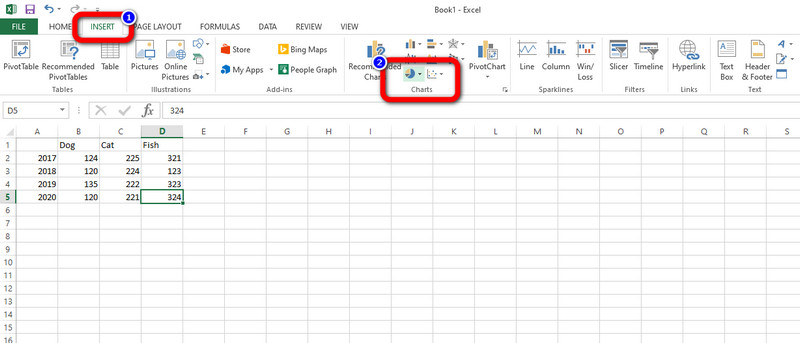
Afterward, to insert the pie chart template, go to the Insert menu on the upper interface. Then, navigate to the Recommended Chart section and click the Pie chart symbol. Then, you will see that all information is turned into a pie chart.
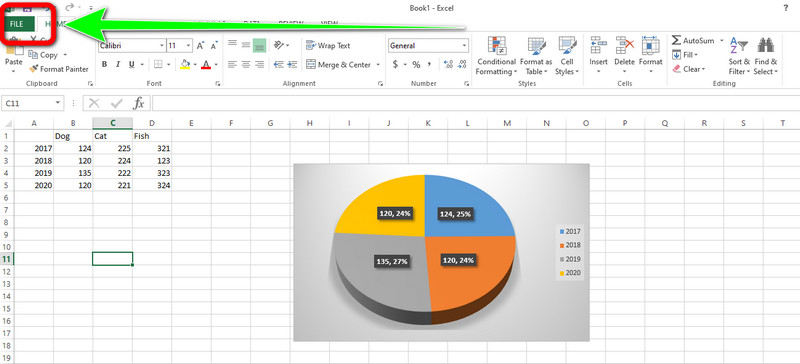
When you finish making the pie chart, click the File menu on the top-left interface for the final step. Then, select the Save as option and save the chart on your computer.
Pros and Cons of Using Excel to Make a Pie Chart
PROS
- The process is simple and perfect for non-professional users.
- It offers various free pie chart templates.
- It lets you modify the labels, style, titles, and more.
- The tool allows you to change the color of each slice.
CONS
- The template won’t show up if the data is not inserted yet on the spreadsheet.
- Installing the program takes time.
- Advanced features are available on the paid version.
Part 2. How to Insert A Pie Chart in Excel
If you want to insert an existing pie chart in Excel, you can do so. Inserting an existing pie chart is more helpful when making a chart. It is because if you plan to create a chart, you can use the existing pie chart and edit the information. In addition, inserting an existing pie chart is simple. You can achieve it in just a few clicks.
Launch Microsoft Excel on your computer. You can proceed to the next step when the interface appears on the screen.
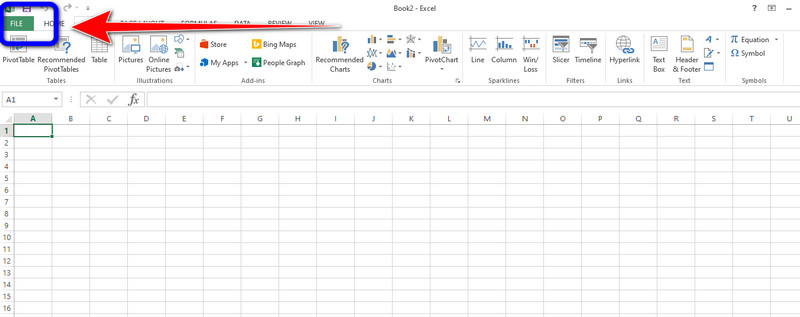
Then, go to the File menu on the upper left part of the interface. Then select the Open option. Look for the existing pie chart and add it to Excel.
After that, you can edit and change the data by adding the existing pie chart in Excel.
When you are done making some changes to the existing pie chart, save the final output. Click the File > Save as option and put the file in your desired file location.
Part 3. Best Alternative Way of Using Excel to Do A Pie Chart
If using an offline program is not your preferred way of creating a pie chart, we have the best alternative. If you don’t want to hassle yourself downloading a program, then MindOnMap is the better pie chart maker you can use. It has a straightforward creation process. It doesn’t require an installation process. You can use the tool directly on your browser. The user interface is also simple to use. Every option, tool, and style is simple to comprehend and apply. Moreover, the program provides all the necessary pie chart components. It includes shapes, lines, text, symbols, colors, and themes. You can be confident that you'll receive the outcome you want with the help of these components.
Furthermore, you can collaborate with other users when utilizing the online tool. Its collaboration features allow other users to edit your pie chart. This way, you don’t need to meet them in person. You can work together even if you are not in the same location. You can even access the tool on all web platforms, making it more convenient for all users.
Secure Download
Secure Download
Go to the website of MindOnMap. Then, click the Create Your Mind Map option.

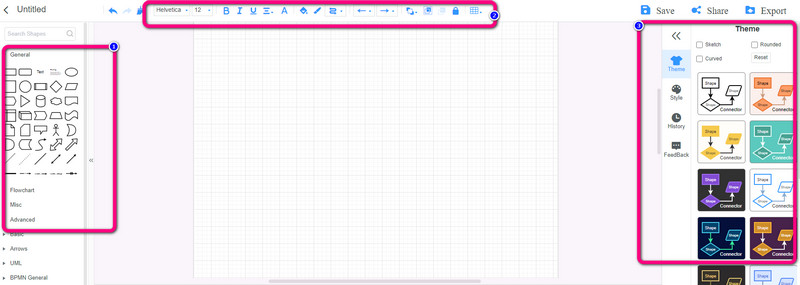
Another interface will show up on the screen. Click the New button and select the Flowchart icon. Then, the tool’s interface will appear on the screen.
You can view all the elements to create a pie chart. Use the shapes on the left part interface. Navigate to the right part interface to use themes. If you want to insert text inside the shape, double-left-click it. Go to the Color Fill option to put color on the shapes.
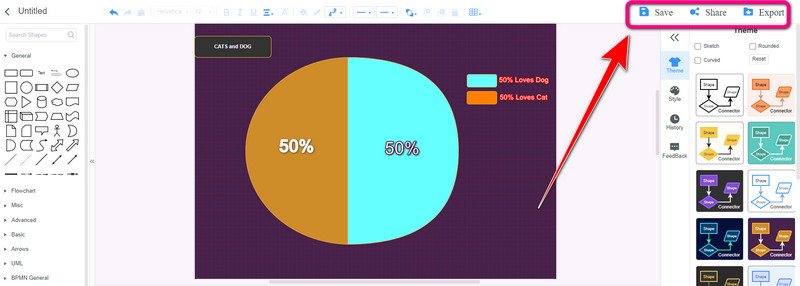
When you finish your pie chart, click the Save button on the top-right interface. Click the Share option to collaborate with other users. Also, click the Export button to save the pie chart in various formats like PDF, PNG, JPG, SVG, and more.
Part 4. FAQs about How to Make A Pie Chart in Excel
What is the disadvantage of a pie chart?
In some instances, a pie chart doesn’t reveal the exact value. Values are expressed by using percentages or ratios.
What does a pie chart represent?
It is a type of graph that shows the data in a circular graph. The slices of pizza represent the relative size of the data. It also requires a list of numerical and categorical variables.
Is a pie chart always in percentage?
No. It depends on how you use the chart and what data you have. It is possible to create a pie chart using non-percentage data as long as the information constitutes all parts of the whole.
Conclusion
After reading the best tutorial from this article, it would be easy for you to create a pie chart. This post taught you how to make a pie chart in Excel. Also, aside from this offline program, we introduced you to the most excellent alternative, MindOnMap. If you prefer creating a pie chart online, use this tool.