Best Guide on How to Create A Pie Chart in Google Sheets [with Alternative]
The pie chart is one of the many visualization options Google Sheets offers. The tool lets you display data and understand how components work together to form the total. Do you desire to know how to make a pie chart using Google Sheets? Then reading this post is the best choice. We will give you all the necessary information when creating a pie chart. In addition, you will also learn how to put a pie chart title and percentages. Moreover, you will also discover another tool you can use for creating a pie chart. What are you waiting for? Begin reading this post and learn everything about pie charting.

- Part 1. Method to Create A Pie Chart in Google Sheets
- Part 2. Best Alternative Way of Making A Pie Chart in Google Sheets
- Part 3. FAQs about How to Make A Pie Chart in Google Sheets
Part 1. Method to Create A Pie Chart in Google Sheets
Are you looking for the best way to arrange data by category? If so, Google Sheets might help you solve your problem. To organize your data, you can use a pie chart. Thankfully, Google Sheets offer various visualization options like pie charts. With the guide of this tool, you can create charts easily and instantly. In addition, there are more things you can encounter when using this online tool. Google Sheets doesn’t require you to create your pie chart manually. The tool offers pie chart templates, making it more convenient for users. You only need to input all the data and insert the free template. Also, aside from that, the tool allows you to put percentages on the chart. You can also change the pie chart title. Moreover, you can change the color of the pie chart based on your preferences.
Furthermore, there are other features you can encounter when using Google Sheets. It has an auto-saving feature wherein it saves your work automatically. This way, your chart won’t disappear if you accidentally remove the tool. You can also use various themes to make your output attractive and pleasing to view. Using themes can make the background of the chart more lively to see. Additionally, sharing the link lets you send the file to other users. You can let them edit your work if you want to change your chart.
However, although it is a helpful tool, Google Sheets has drawbacks. You need to create a Google account first before using the tool. You can’t use Google Sheets without a Gmail account. Also, themes are limited. You can only have a few options when using themes for your chart. In addition, when inserting a chart, a bar chart will appear automatically. So you need to change the chart on the Chart editor section first to show the pie chart. Lastly, an internet connection is highly recommended. See the step below to learn how to do a pie chart in Google Sheets.
Open your browser and start creating your Google account. After that, navigate to the Google apps sections and select the Google Sheets option. Then, click or open a blank document to start creating your chart.
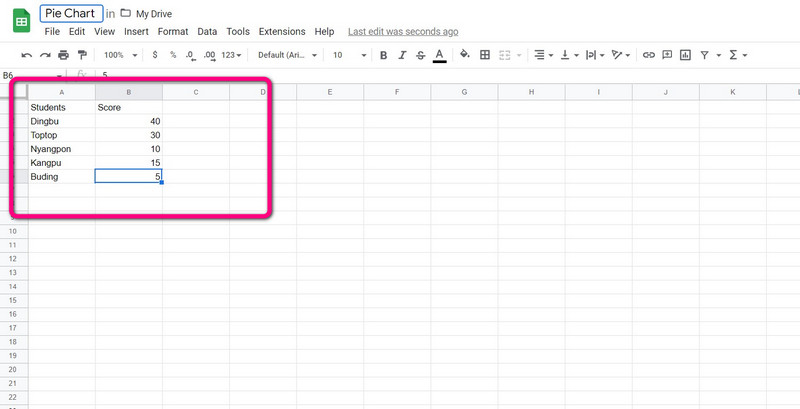
The next step is to input all the necessary data on your pie chart. Click the mini boxes or the cells and start typing all the information.
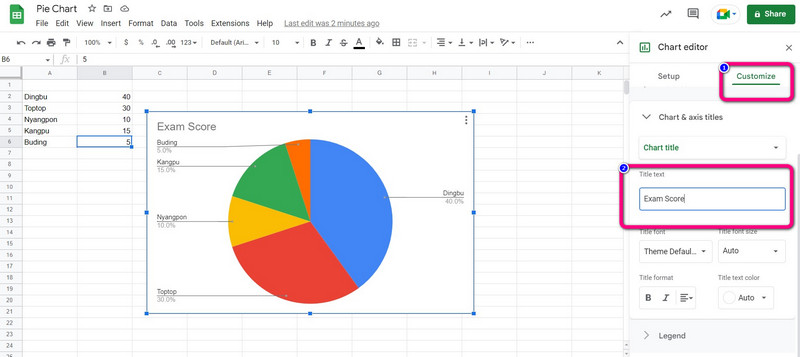
If you desire to learn how to change the title of a pie chart in Google Sheets, go to the Customize section. Then start typing the title under the Title Text option.
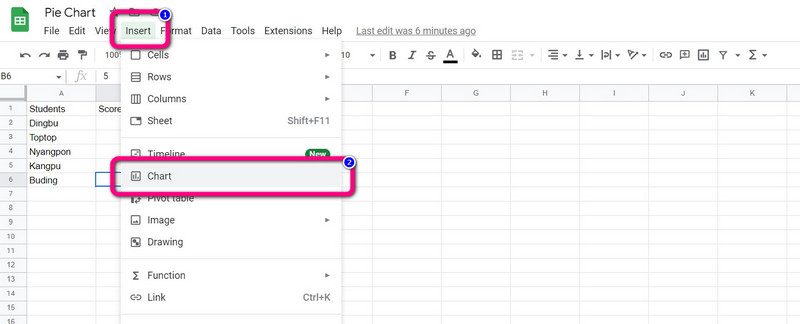
After adding all the information, you can start creating a pie chart. Navigate to the Insert menu and select the Chart option.
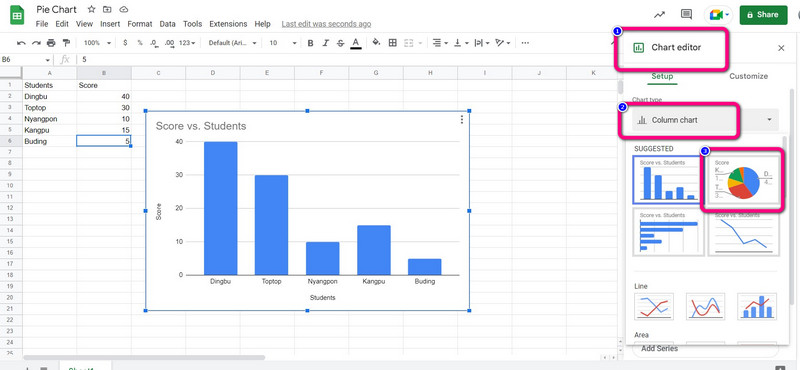
Then, a bar chart will automatically appear on the screen. Select the pie chart from the Chart Editor > Column Chart option. After that, a pie chart will show up in Google Sheets.
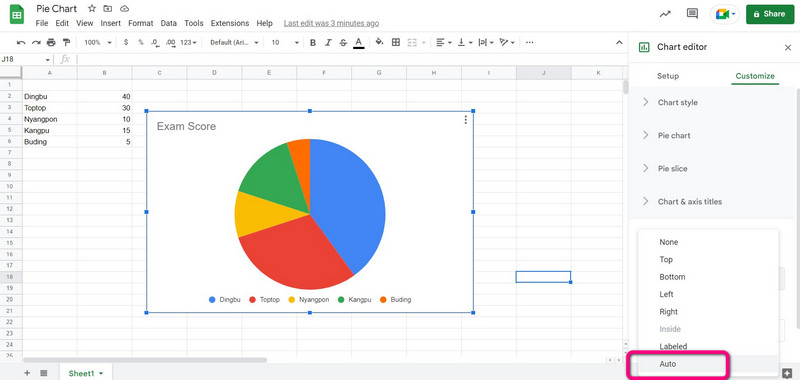
As you can see, the information is in the chart, and the percentage will appear automatically. If you desire to know how to add the percentage in Google Sheets, go to the Customize section. Then, click Legend > Position and select the Auto option. Then, the percentage will appear on the pie chart.
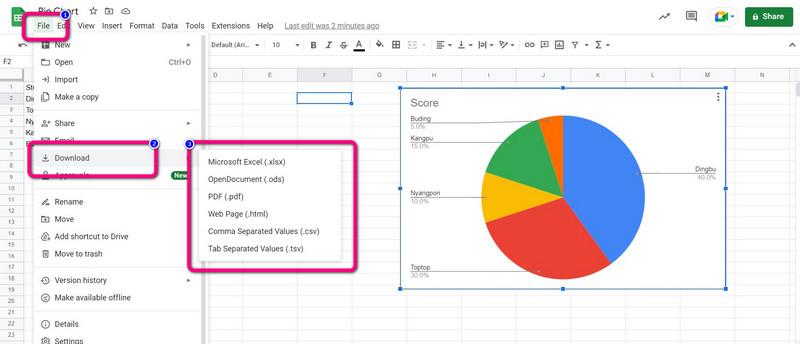
After making your pie chart, go to the File menu and click the Download option. Then, select your preferred output format.
Part 2. Best Alternative Way of Making A Pie Chart in Google Sheets
Are you looking for another way to create a pie chart? You can use MindOnMap. Using this online tool makes creating a pie chart simple. It has a straightforward pie charting process. The web-based utility has a user-friendly interface. The tool also provides all the components you require to make a pie chart, like shapes, lines, text, symbols, colors, themes, and more. You can be confident that you'll acquire the outcome you want with the aid of these components. It has an auto-saving feature wherein it saves your chart automatically each second. This way, your pie charts are safe and won’t get deleted easily.
Moreover, your chart is shareable with others. You can copy the link of your work to collaborate with your teams, partners, and more. Save the final pie chart as SVG, PDF, JPG, PNG, and other output formats. MindOnMap is available on all platforms. You can access it on Google, Firefox, Safari, Edge, and more. Use the method below to create a pie chart.
Secure Download
Secure Download
Open any browser from your computer and go to the main website of MindOnMap. Create your account to proceed with the pie charting process. After creating an account, click the Create Your Mind Map option.

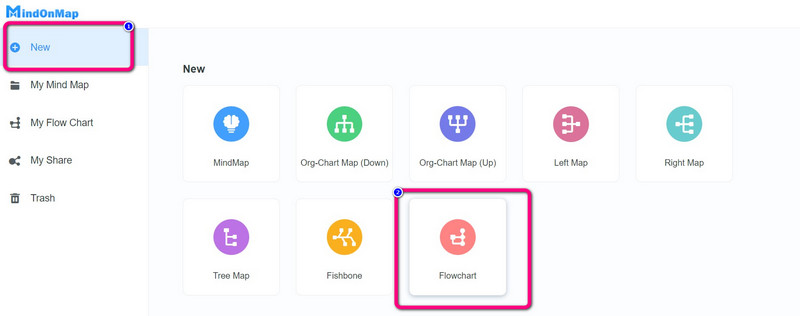
Another web page will appear on the screen. Select the New option on the left screen and click the Flowchart icon.
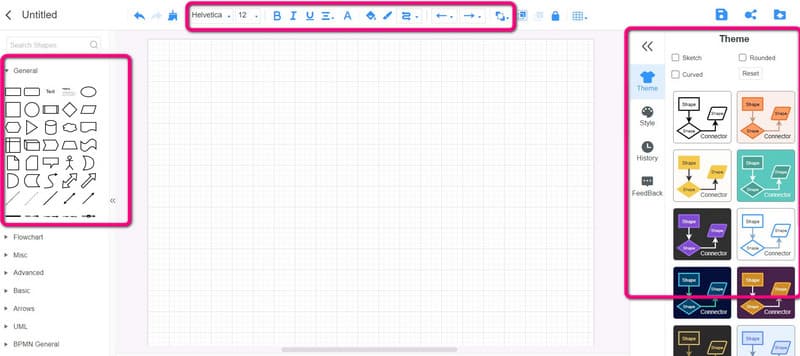
The main interface will then show up. There are numerous tools available for use. To utilize Shapes, navigate to the left-part interface. Double-left-click the shape to add text there. To color the shapes, select the Fill color option. Use the Theme on the right interface to give your chart additional impact.
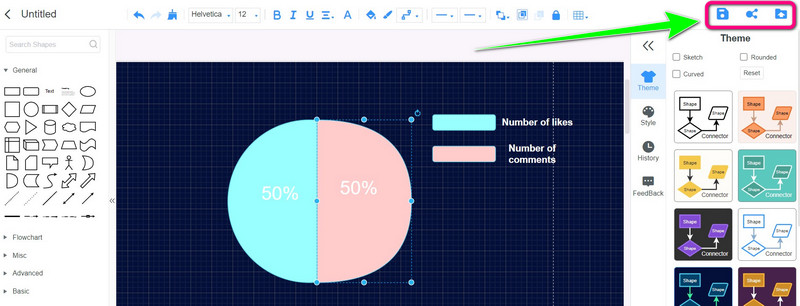
Click the Export option to export your completed pie chart in various formats. To share the URL with other users, select the Share option. To save the pie chart to your account, click the Save option.
Part 3. FAQs about How to Make A Pie Chart in Google Sheets
1. How to make 3D pie charts in Google Sheets?
The 3d pie chart option is available in the chart editor pane if you are creating a pie chart. Go down to the selections for pie charts in the drop-down menu for the chart type. Choose the 3D pie chart, the third pie chart choice. After creating your pie chart in the same manner in the chart editor, you can still convert it to a 3d pie chart. You can select 3D under the customize option.
2. How to create a pie chart in Google Sheets that looks better?
You can go to the Chart Editor section to improve your pie chart. You can change the chart style, like making the pie in 3D or maximizing it. You can also change the color of each category. Also, you can use various themes. This way, you can have a great-looking pie chart.
3. How do I label a pie chart in Google Sheets?
Use the Personalize option from the Chart editor to label a pie chart. Open the Pie chart section by clicking on it, then click the drop-down menu next to the Slice label. You can choose the style, format, and font for the labels on your pie chart in addition to the label type.
Conclusion
This guidepost taught you how to make a pie chart in Google Sheets. In that case, you will get an idea if you plan to create a pie chart. Also, besides Google Sheets, you have discovered another way to make a pie chart using MindOnMap. If you want a more straightforward method with numerous themes, use this online tool.