A Comprehensive Guide to Mandala Chart: Visualize Your Goal
The Mandala Chart is a helpful tool/framework for organizing ideas, achieving balance in life, and organizing goals. This tool originated from a Buddhist symbol. It uses a grid of nine squares to expand a central theme into interconnected perspectives, which helps individuals see both big pictures and fine details. By mapping out your ideas visually, the Mandala Chart can show clarity, holistic problem-solving, and creativity. So, if you want to learn more about this kind of framework, see this post and explore its benefits, purpose, how to use it, and how to visualize your goals using an exceptional chart maker.

- Part 1. What Is a Mandala Chart?
- Part 2. Purpose and Benefits of Mandala Chart
- Part 3. Visualize Goals Using MindOnMap
- Part 4. FAQs about Mandala Chart
Part 1. What Is a Mandala Chart?
The Mandala Chart is a visual representation tool that is helpful for individuals. It can help them arrange their ideas, set specific objectives, and maintain balance across various aspects of life. This chart represents harmony and interconnectedness since it originates from a Buddhist symbol. Plus, the chart itself is structured as a 3×3 grid, with a central theme placed in the middle of the chart, surrounding squares expanding on related perspectives. The good thing about this chart is that it ensures that all the ideas are being explored, so no single area is overlooked.
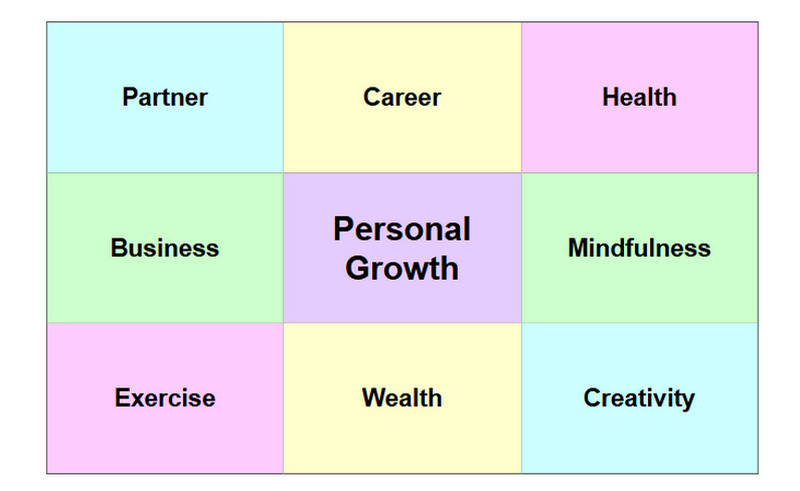
Furthermore, the Mandala Chart has evolved into a useful tool for coaching, productivity, and strategic planning. It makes it easier for individuals to see both the big picture and concrete action steps by breaking complex goals into smaller, connected components. Similar to other structured planning tools like the RACI Chart, the Mandala Chart helps improve organization, role clarity, and decision-making during project planning and execution. Its holistic approach promotes clarity, creativity, and balance, making the Mandala Chart a flexible tool for problem-solving, personal growth, and long-term success.
Part 2. Purpose and Benefits of Mandala Chart
The Mandala Chart is not just a simple visual representation tool. It can give you various benefits that you can imagine. Check this section and get more ideas about its benefits, along with its purpose.
Purpose of Mandala Chart
- • The chart can provide a structured framework for organizing thoughts and goals. It can even encourage holistic thinking by connecting a central topic/theme to multiple ideas.
- • It helps break down complex objectives into manageable and actionable parts.
- • The chart can promote balance across various aspects of life, including relationships, health, work, personal growth, and more.
Benefits of Mandala Chart
- • Holistic Thinking – The chart ensures that you can see the big picture while considering details.
- • Goal Clarity – It can help you make your goals more specific and simple to achieve.
- • Boost Creativity – By creating a chart, you can spark new ideas. You can even explore all the ideas that are connected with the main theme.
- • Balanced Growth – It can support harmony between the professional and personal aspects of life.
- • Better Prioritization – using a chart can help you identify what is most important and align actions accordingly.
How to Use a Mandala Chart
If you want to use the Mandala chart, you can follow the steps below.
Center Goal
The first step is to write your main goal objectives in the middle of a 3×3 grid.
8 Core Branches
After writing the main theme, you can now start adding eight related perspectives or categories. Some of the examples are relationships, career, health, creativity, finances, contribution, leisure, and more.
Secondary Objectives
For each branch, you can expand further by creating another 3×3 grid, placing the branch in the center. This is perfect if you want to add more perspectives that can make your chart comprehensive and appealing.
Example of Mandala Chart
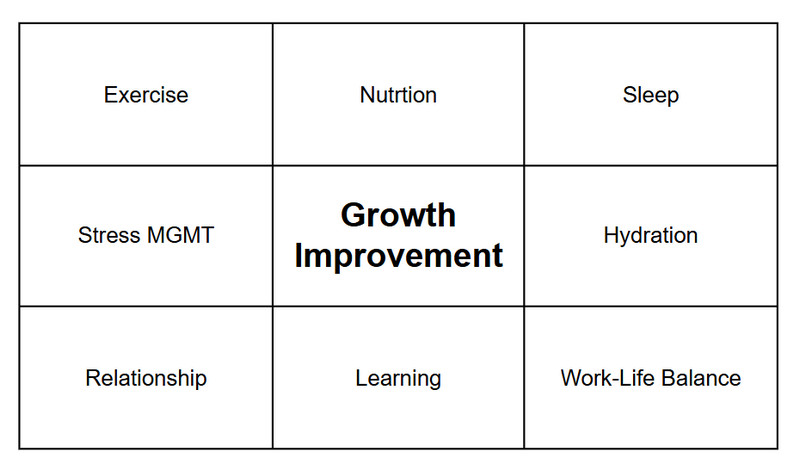
The example is about a Personal Growth Goal. As you can see in the sample, the main theme is Growth Improvement. Then, the eight core branches are nutrition, exercise, sleep, stress MGMT, hydration, relationship, learning, and work-life balance. With this chart, you can see your goal and what are the related ideas/perspectives that you can focus on.
Use Cases of Mandala Chart
1. Personal Growth
Center Goal: Self Improvement
8 Core Branches: Health, Learning, Relationships, Finance, Creativity, Career, Mindfulness, and Leisure.
Guide individuals to balance growth in various aspects of life while keeping the big picture/main objective in focus.
2. Business Strategy
Center Goal: Company Growth
8 Core Branches: Marketing, Service, Finance, HR, Sales, Customer, Innovation, and Partnerships.
This chart can enable leaders to break down strategic goals into actionable steps.
3. Project Management
Center Goal: Successful Project Delivery
8 Core Branches: Scope, Risks, Communication, Quality Timeline, Budget, Team Roles Control, and Stakeholder Engagement.
It can provide a structured manner to manage complex projects. It ensures that all critical aspects will be tracked and addressed.
Is there a Mandala Chart Template?
There are various templates you can use. Some of the tools that can give you templates are MS Excel, MS PowerPoint, Word, Google Sheets, and more. You can even use some collaboration tools, like MindOnMap, Miro, XMind, etc.
Its Difference to the Shohei Ohtani Goal Matrix
The general purpose of the Mandala Chart is to organize a central objective surrounded by eight supporting ideas. It is designed for holistic thinking, creativity, business, balance, and expanding perspectives in life.
Part 3. Visualize Goals Using MindOnMap
Do you want to visualize your goal by creating a Mandala Chart? In that case, we suggest using MindOnMap Maker. This chart maker can help you visualize your goals since it can provide all the tools you need, such as tables, color, text, and more. You can even create an appealing chart by using the Theme feature. Plus, the tool has a comprehensive layout, allowing you to use all the functions without any trouble. You can even save your chart in many ways. You can keep it on your MindOnMap account for preservation, or save it in various formats. Thus, if you need an exceptional chart maker, it would be better to start using MindOnMap.
You can start accessing MindOnMap by clicking the buttons below. Then, add your account.
Secure Download
Secure Download
Then, proceed to the New section and use the Flowchart feature. After the loading process, the main UI will appear on your screen.
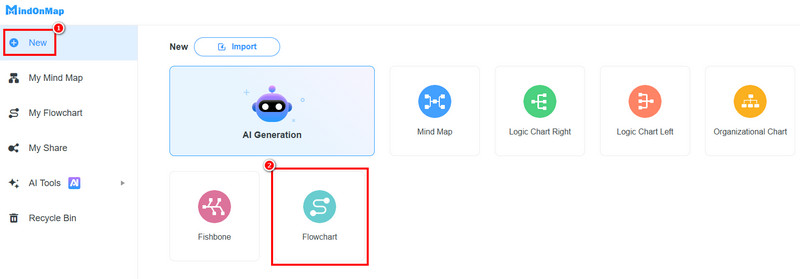
You can start creating the Mandala Chart. Click the Table feature above to start adding a table to the canvas. After that, double-click the table to add all the information you need.
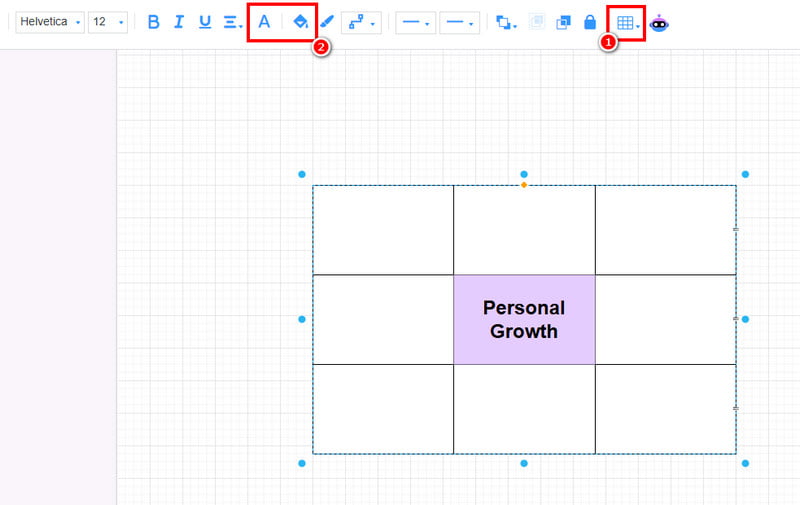
You can also use the Font and Fill Color functions above to add color to the text and table.
Once you are done creating the Mandala Chart, click the Save button. You can also use the Export feature to save the chart on your device in your preferred format.
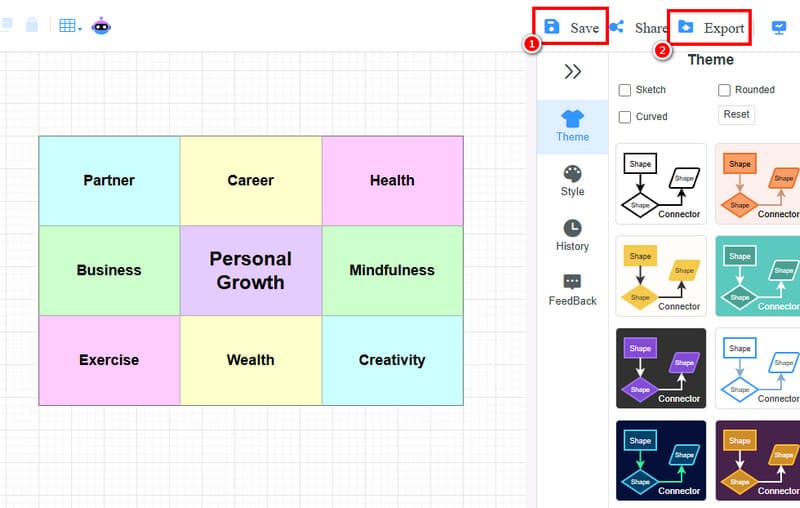
Click here to see the entire Mandala Chart designed by MindOnMap.
Part 4. FAQs about Mandala Chart
How do you use the Mandala Chart?
Well, using the Mandala Chart is simple. All you need is to create a 3×grid box, insert the main theme at the center, and surround it with the related perspectives. In that way, you can create a structured and engaging output.
What is the Shohei Ohtani Harada Method?
It is about how Shohei used the Harada Method to achieve his goal. He placed his main goal at the center. Then, he surrounded it with eight supporting goals, such as physical training, batting skills, pitching skills, and more. This method helps him to grow and be a successful athlete.
Can I use a Harada method template?
Yes, there are Harada Method templates available online, including interactive web-based versions and downloadable PDFs. These templates help you structure your main goal, break it into eight focus areas, and define 64 actionable steps for disciplined daily practice.
What is the best tool for creating a Mandala Chart?
There are various tools you can rely on to create a Mandala Chart. Some of them are MindOnMap, MS PowerPoint, EdrawMind, and more.
What is the purpose of the Mandala Chart?
The main purpose of the chart is to provide a visual framework for organizing goals, ideas, and actions in a balanced manner. It can also assist individuals or businesses to view connections between different aspects of life or work, encouraging holistic thinking and better decision-making.
Conclusion
Mandala Chart is an excellent visual representation tool that can help you organize information, especially when talking about personal and professional aspects of life. Thanks to this post, you have learned everything about the chart, including its purpose, benefits, how to use it, and more. Plus, if you need the best tool for creating a Mandala Chart to visualize your goal, we suggest using MindOnMap Flowchart Maker. This tool ensures that you can organize all the information, making it the best tool for users.