How to Create A Bar Graph in Google Sheets with the Best Alternative
Are you a user that needs more knowledge about creating a bar graph? If you are a beginner, you may need to know the method of making a bar graph efficiently. Worry no more! If you are going to read this guidepost, you will get the answer that you seek. Please read the article as we offer you the most effective method on how to make a bar graph in Google Sheets. In addition, you will also learn the best alternative to Google Sheets for creating a bar graph. To discover all these informative details read more to find out.

- Part 1. How to Make A Bar Chart in Google Sheets
- Part 2. Alternative Way of Creating A Bar Chart in Google Sheets
- Part 3. FAQs about How to Make A Bar Graph in Google Sheets
Part 1. How to Make A Bar Chart in Google Sheets
To organize and sort data most understandably, you must create a visual representation like a bar graph. Thankfully, Google Sheets can provide the visualization tool that you need. If you want to produce a bar graph for organizing information, you can do so. The online tool can offer bar graph templates for bar graphing procedures. It does not require you to create templates manually. You can use a free template to insert all the data in the cells. Aside from that, Google Sheets allows you to change the color of each rectangular bar. With this, you can make your graph unique and pleasing to view. Furthermore, while in a bar graphing process, the tool can save your work automatically for every change you make. To give more impact on your bar graph, you can even use various templates, and they are free. With the help of these free templates, you can give color to the background of the graph. Another feature you can enjoy is the collaborative feature. You can send the link to other users to let them view and edit your bar graph. Also, this feature is helpful for brainstorming with other users, making it convenient.
However, even though Google Sheets is reliable for setting up a bar graph, you can still encounter limitations. You need to create a Gmail account first before creating a bar graph. You can’t use the Google Sheets tool without Gmail. Also, the themes are limited. You can only use a few themes when creating a bar graph. Also, since Google Sheets is an online tool, you must have internet access. Follow the simple steps below to learn how to make a bar chart in Google Sheets.
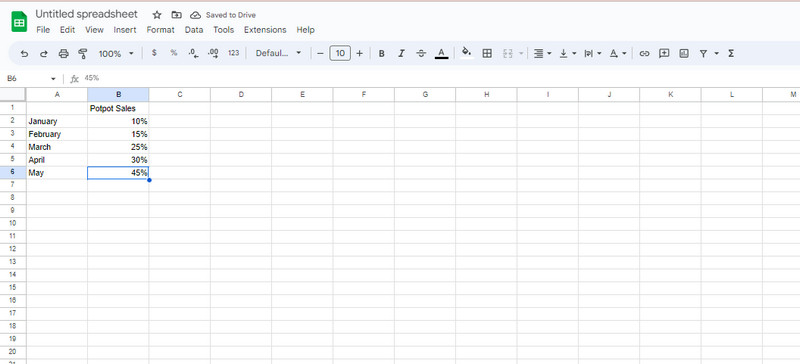
Go to your web browser and create a Google account. After that, open your Gmail and go to the Google Sheets tool. Then, open a blank sheet to start the bar graphing process.
The following step is to insert all the information you need for your bar graph. Click the cells to insert all the data.
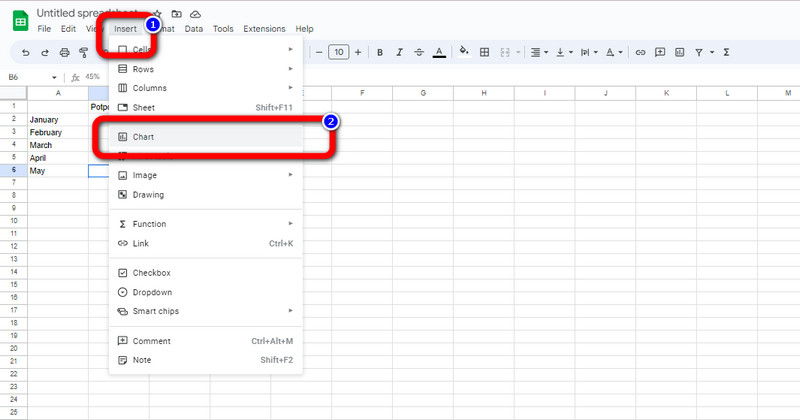
After that, navigate to the Insert menu on the upper interface. Then, click the Chart option. You will see that the bar chart will automatically appear on the screen.
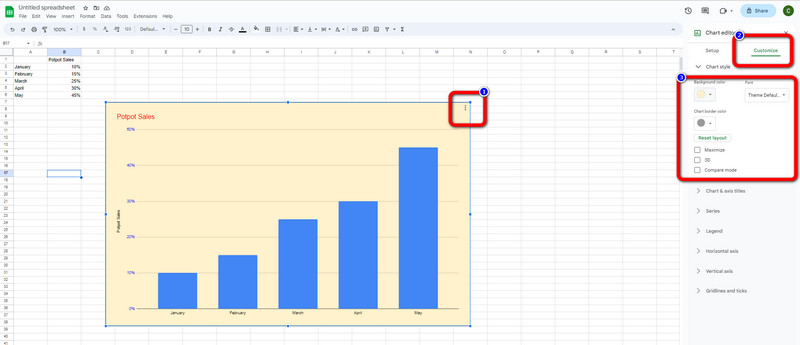
When the bar graph is already on the screen, you can customize it. If you want to learn how to change the color of the bar graph in Google Sheets, follow this step. Click the three dots in the upper corner of the graph. Then, click the Edit Chart option. Afterward, click the Customize > Chart Style option and click the Background color. You can choose your preferred color for your bar chart.
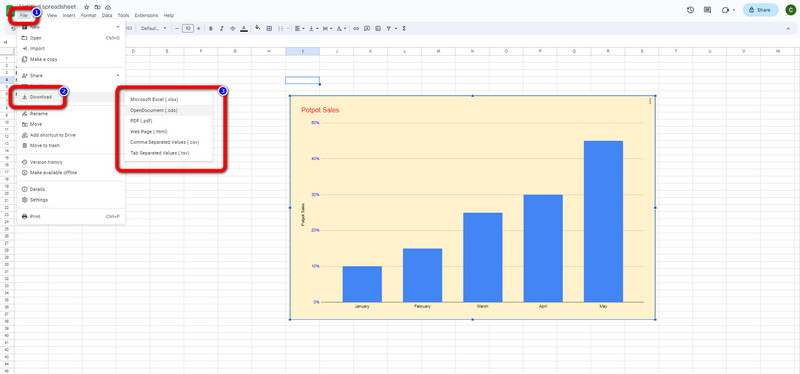
When you finish the bar chart, proceed to the saving process. Navigate to the File menu and click the Download option. Then, you can choose what format you want on your bar chart, like PDF, DOCS, HTML, and more. After clicking the desired output format, the exporting process will start.
Part 2. Alternative Way of Creating A Bar Chart in Google Sheets
Aside from Google Sheets, you can use a remarkable bar graph maker online. You can use MindOnMap for the bar graphing process. This free bar graph creator can provide everything you need. You can use rectangular shapes, numbers, text, and lines. You can also create a colorful bar graph using free themes and color-fill tools. With the help of these tools, your bar graph will become satisfying. Additionally, MindOnMap has an easy-to-understand layout, making it suitable for beginners. It also has a smooth exporting process. You can export your bar graph easily without encountering any problems. Moreover, the bar graph maker can offer excellent features. It is possible if you want other users to edit your bar graph. Its collaborative feature lets you share your output by copying a link from your MindOnMap account.
Also, aside from this feature, you can enjoy its auto-saving feature. While you are making your bar graph, MindOnMap is capable of saving your work automatically. This way, you won’t lose your graph even if you turn off your device unintentionally. Furthermore, accessing the tool is easy. MindOnMap is available to all website platforms. You can create your bar graph with a browser on your device. You can use mobile phones, Windows, or Mac computers. Follow the simple instructions below to create a bar graph.
Secure Download
Secure Download
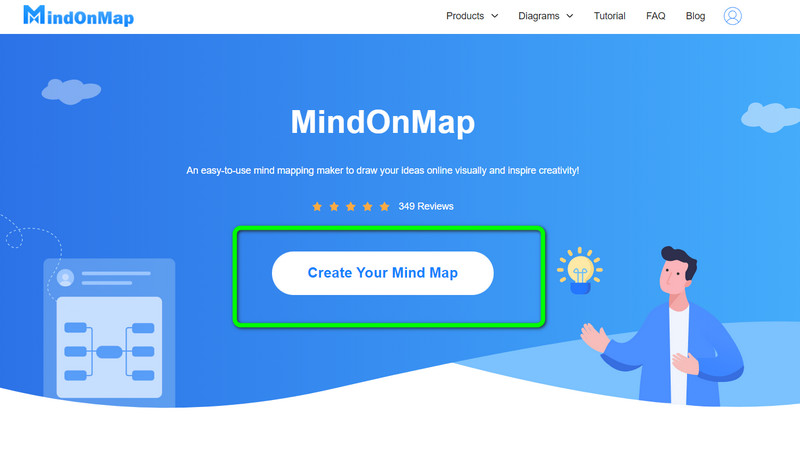
Access MindOnMap by opening your browser. Then, start creating your MindOnMap account. If you don’t want to sign up, you can use your Gmail account to connect to MindOnMap. The web page will appear on the screen when you already have an account. Click the Create Your Mind Map button from the center part of the web page.
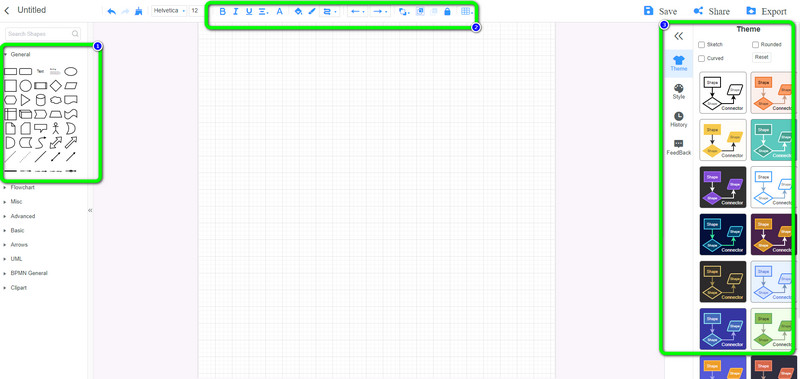
Then, another web page will appear. On the left part, select the New menu, then click the Flowchart icon. After clicking, the tool's main interface will appear on the screen.
To start creating a bar graph, go to the left interface to use shapes, text, numbers, and more. Go to the upper interface to change font styles, add colors, resize text, and more. To use various themes, go to the right interface.
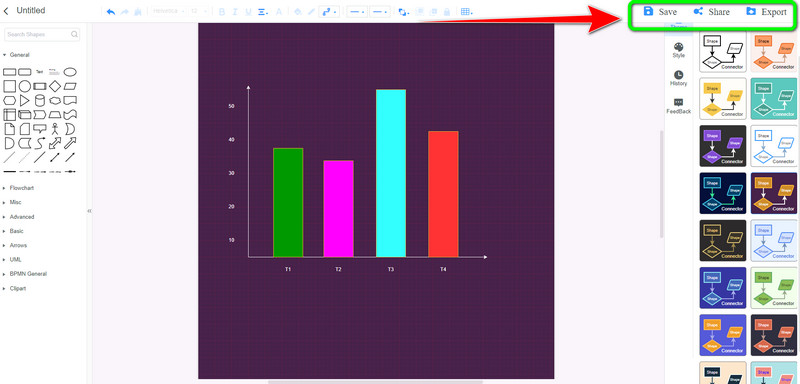
Then, when you are done making a bar graph, you can proceed to the saving process. To save your bar graph on your account, click the Save button. To save your graph to other formats, click the Export option. To collaborate and brainstorm with other users, click the Share option and copy the link.
Part 3. FAQs about How to Make A Bar Graph in Google Sheets
1. How to make a double bar graph in Google Sheets?
Open your Google Sheets and launch a blank sheet. Then, insert all the data you need for your bar chart. After that, go to the Insert > Chart option. Then, from the Chart editor, go to the Chart type option and select the double bar graph option.
2. Can I create a horizontal bar graph in Google Sheets?
Of course, you can. Google Sheets can offer a horizontal bar graph template. Go to the Chart types, look for the horizontal bar graph template, and click it.
3. Is Google Sheets good for data visualization?
Yes, it is. Google Sheets can offer various visualization tools to make the data clear and simple to interpret. If you want to organize or compare data through bar graphs, you can rely on Google Sheets.
Conclusion
To sum it up, you can read this guidepost to learn how to make a bar graph in Google Sheets. We will give you all the details to organize and compare data through bar graphing. Also, you have learned another way to create a bar graph using MindOnMap. So, you can use this online bar graph creator to produce an excellent and understandable bar graph.