Detailed Review: PERT Chart vs Gantt Chart (Features, Pros, Use Cases)
Project planning and scheduling are important for successful project management. Among the many tools available, PERT Chart and the Gantt Chart are the most popular tools and they serve different purposes and are suited to different types of projects.In this article, we will see their unique features, pros, and how you can easily create both with MindOnMap.
- Part 1. What is a PERT Chart?
- Part 2. What is a Gantt Chart?
- Part 3. Differences Between PERT Chart and Gantt Chart
- Part 4. Create PERT Chart and Gantt Chart with MindOnMap
- Part 5. FAQs
Part 1. What is a PERT Chart?
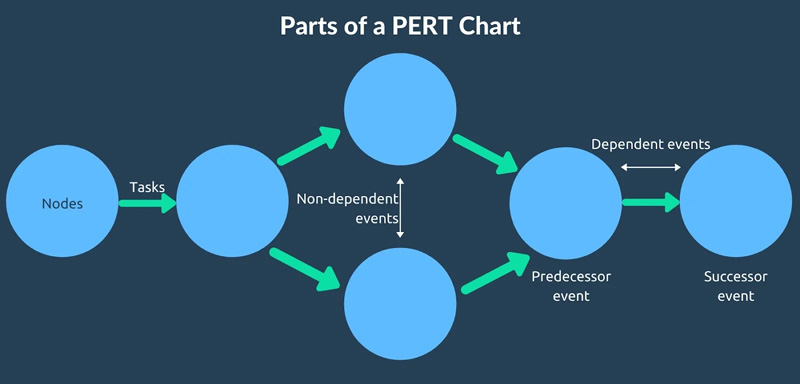
PERT means Program Evaluation and Review Technique. Developed in the 1950s, a PERT Chart is a project management tool used to schedule, organize, and coordinate missions within a project. It helps to break down complicated projects into detailed steps, showing the task, order and time.
Features:
• Network-based Visual: Use node and arrows represent tasks.
• Focus on Task Dependencies: Shows which tasks must precede others.
• Estimates Time: Uses optimistic, pessimistic, and most likely time estimates to calculate expected task durations.
• Ideal for Complex Projects: Best used when tasks are interdependent and need careful time management.
Pros:
• Clear visualization of task relationships
• Identification of the critical path
• Helps predict project completion time
Use Cases:
• R&D Projects
• Software Development
• Event Planning
Part 2. What is a Gantt Chart?
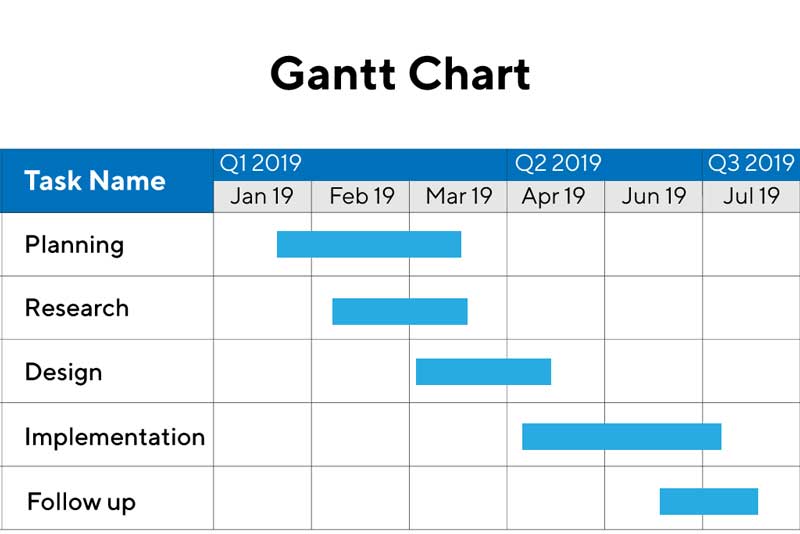
Different from the PERT Chart visualized by nodes and arrows, a Gantt Chart uses a clean bar to illustrate different tasks, start time, end time and duration. It gives a clear demonstration of each activity and shows the dependency and relationship between activities.
Features:
• Time-based Chart: Shows tasks on the vertical axis and time intervals on the horizontal axis.
• Bar Representation: Each task is represented by a bar, with length indicating duration.
• Real-time Progress: Easily tracks which tasks are completed, in progress, or delayed.
• User-Friendly Format: Great for quick updates and visual clarity.
Pros:
• Simple and easy to understand
• Visual timeline for task durations
• Useful for assigning responsibilities and deadlines
Use Cases:
• Marketing Campaigns
• Construction Projects
• Product Launches
Part 3. Differences Between PERT Chart and Gantt Chart
Now that we understand what each chart is, let’s explore the key differences between PERT Chart vs Gantt Chart:
| PERT Chart | Gantt Chart | |
| Purpose | Focuses on sequence of tasks and their dependencies. | Focuses on scheduling and tracking task progress over time. |
| Representation Type | Network diagram (flowchart-like) | Bar chart (timeline-based) |
| Visualization | Nodes represent activities; arrows show dependencies. | Bars represent tasks; length shows duration on a timeline. |
| Best For | Planning and analyzing complex projects with interdependent tasks. | Monitoring and managing project timelines and progress. |
| Critical Path | Used to find the critical path (longest path determining total project time). | May show critical path but not as clearly as PERT. |
| Flexibility | Useful during project planning stage. | Useful during project execution and tracking. |
Part 4. Create PERT Chart and Gantt Chart with MindOnMap
Creating both PERT and Gantt Charts doesn’t have to be complicated. MindOnMap is a fast and easy diagram and mind map creator. With MindOnMap, you can design professional, clean, and shareable charts in just a few steps. It has built-in free templates of family tree, ORG chat, etc. What’s more, you can also utilize the AI function to help to build a map automatically.

Key Features
• Free and online mind map tool
• Automatically AI mind mapping
• Intuitive and easy operation
• Multiple chart templates available
How to create PERT Chat and Gantt Chat with MindOnMap
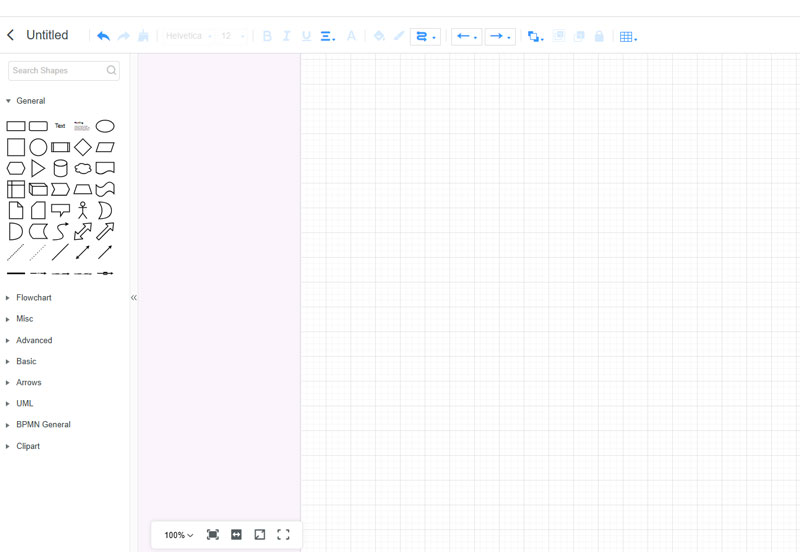
Open MindOnMap on your computer. Click the Create Online button. After that, you can begin drawing your PERT and Gantt chart.
Select My Flowchart and choose the figures and elements you need for your chart when you reach the editing panel.
Once you are done editing, save the final version of the diagram. Click on the Export and save the chart to PDF, Word, SVG, and image file. Optionally, you can share it with your friends and colleagues for preview or checking.

Part 5. FAQs
What is the main advantage of using a PERT chart?
The main advantage of a PERT (Program Evaluation and Review Technique) chart is that it helps plan, schedule, and coordinate complex projects efficiently, especially when task durations are uncertain.
It allows project managers to identify the critical path, predict project completion time, and allocate resources effectively.
What are three components of a PERT chart?
Events (Nodes): Represent key milestones or the start/end of activities.
Activities (Arrows): Show the tasks or operations that connect events.
Time Estimates: Include the optimistic, pessimistic, and most likely times used to calculate expected durations.
What are the six steps in PERT?
Identify all project tasks and major milestones.
Determine task sequence and dependencies.
Construct the network diagram (nodes and arrows).
Estimate time for each task (optimistic, pessimistic, most likely).
Determine the critical path — the longest path through the network.
Update and revise the chart as the project progresses.
Conclusion
Understanding the differences between a PERT Chart vs Gantt Chart is essential for effective project management. Each chart has its unique strengths and uses cases. With tools like MindOnMap, you don’t need to be a project management expert to visualize your plans and keep your team aligned. Start today with MindOnMap and elevate your planning strategy with clear, efficient diagrams.